The research found that while more than one third (37%) of buyers were managing a sustainable programme pre-pandemic, 25% of sustainable programmes have been introduced during the global pandemic, and a further 23% of buyers are planning to initiate a sustainable travel programme for their business.
The study shows that just 8% of the respondents admitted they don't have a sustainable travel programme, a significant decline on the 60% who said the same in 2019. Notably, the level of buyers who said their programme was not sustainable because of the cost of implementing it has fallen, from 25% in 2019 to just 1% now. This shows that price will be no barrier to meeting sustainability targets.
One in five European travel managers are leaning on their TMC to ensure their programme is sustainable. When asked 'how sustainable' their programme is, 20% said they would rely on their TMC to ensure their programme is sustainable: a similar number (20%) said they would consider their programme's impact on the environment and make choices to limit this.
Further, one in ten (11%) said they were conscious of the human rights impact of their programme and were making choices to limit this, 4% said they had introduced policies designed to improve their travellers' mental health, including a safe space where they can discuss the impact of travel on their well-being, while 3% said they will offer travellers information on their carbon footprint and offset aviation-related carbon emissions.
The latter two answers represent a significant reduction on levels recorded in Nov-2019 - 27% and 17%, respectively - and suggest travel managers are taking more responsibility for the sustainability drive and not relying on the former questionable methods of offsetting travel.
The COVID-19 pandemic has certainly given the industry time to look more closely at its sustainability credentials and it is widely accepted that the subject will have a much higher weighting in travel decisions in the future.
The major global health crisis has left an indelible mark on life, but has also opened doors for new opportunities. Habits and demand are changing and there are an increasing number of start-up businesses taking advantage of the crisis, innovating, deploying new technology and personalisation to target a reengaging audience.
They say 'a picture paints a thousand words'. In this regular section CTC - Corporate Travel Community offers an illustrative insight into a key industry observation or trend, this week highlighting research from BusinessFinancing.co.uk that uses data from the World Bank's 'Doing Business 2020' report to examine the start-up cost for a small-to-medium-size enterprise in the largest business cities across 190 countries. There are some surprising results. You can click on the image for a higher-resolution version of the map.

This regular section also now incorporates and expands on the charts produced in the 2020 air capacity series 'Coronavirus Statistics Snapshot'. These are based on an analysis of OAG schedule data and include a weekly look at how the pandemic is impacting global flight levels in the world's largest markets; a week-on-week and year-on-year comparison of flight departures by geographical region and a look at how weekly capacity is trending: the latter comparing levels to 2020 and also to the 2019 baseline performance.
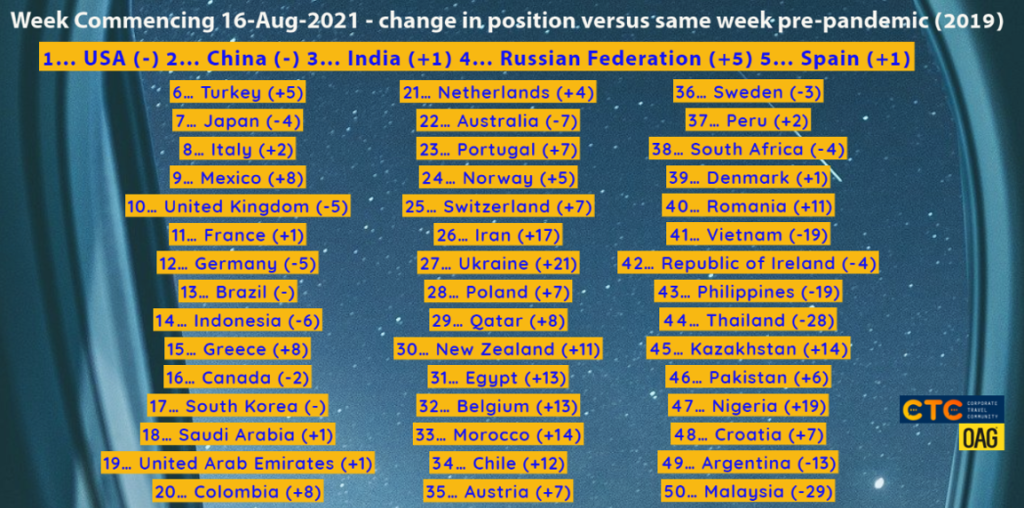
HEADLINE FIGURES FOR WEEK COMMENCING 16-Aug-2021:
Departure frequencies up +0.34% versus last week; up+26.24% versus 2020 and down -33.67% versus 2019.
Seat capacity up +0.49% versus last week; up +27.85% versus 2020 and down -35.29% versus 2019.
CHART: Week-on-week change in flight departures by region
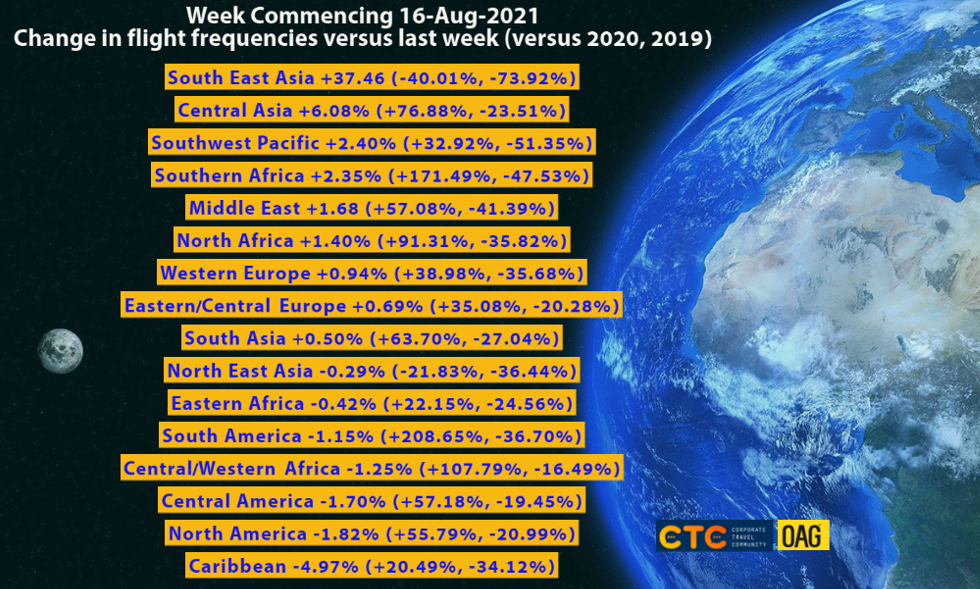
CHART: Year-on-year weekly departures performance for world's top 30 markets versus 2019
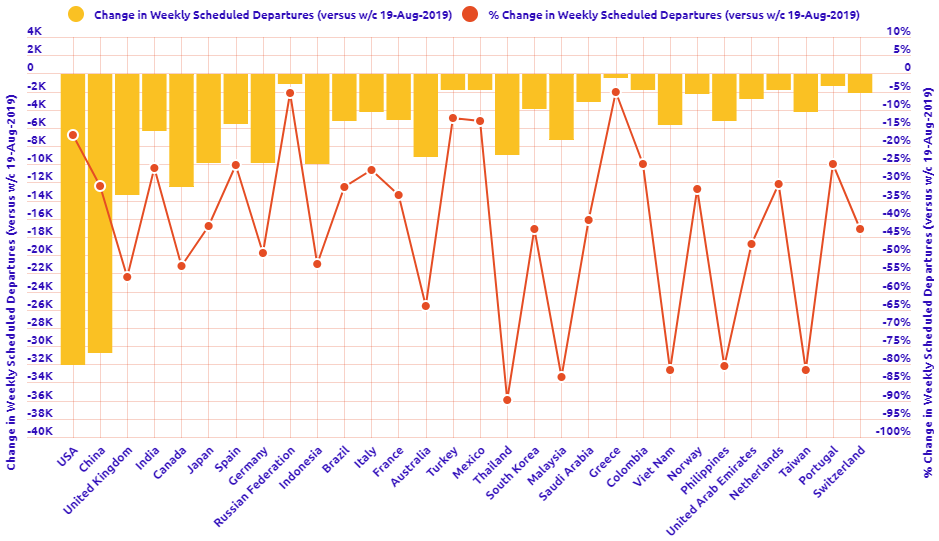
CHART: Year-on-year weekly departures performance for world's top 30 markets versus 2020
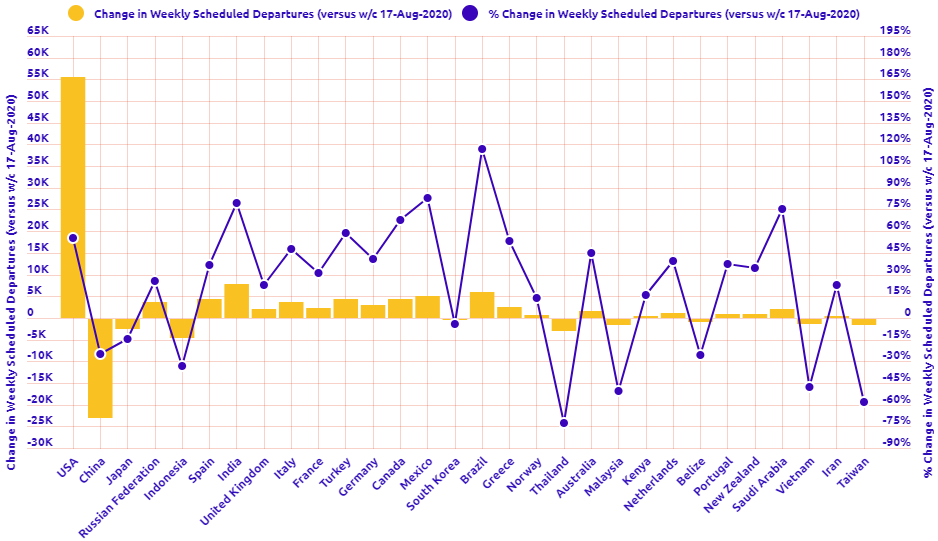
CHART: Departure capacity trends with year-on-year performance

CHART: Departure capacity trends versus 2019
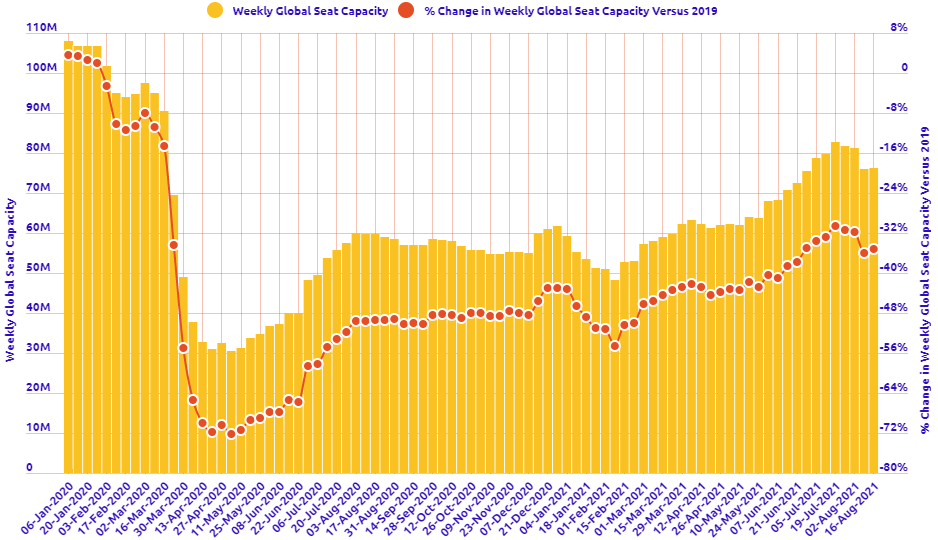
CHART: The world's biggest aviation markets by departure seats