Annual passenger numbers had leaped from just under 2.7 billion in 2010 to 4.5 billion in 2019. The new decade was being entered with strong optimism, albeit with concerns over global trade disputes and a need to be increasingly aware of environmental issues and sustainability drives. The 2020s were expected to be another strong decade of air travel growth with 2020 projected to see an additional 180 million passengers on top of the levels seen in the last year of the previous decade.
But for all of us the world has changed. There is no such thing as normal anymore as we reinvent all aspects of life, at all levels, for the new world that has been in born in 2020. It is clear, 2020 will be a milestone moment in everyone's calendar. Whether Covid-19 proves to be a once in a lifetime pandemic, perhaps a generational problem, or worryingly a regular new evil, it has left an indelible mark on the world and that has not been felt harder than in the travel, transport and hospitality industries.
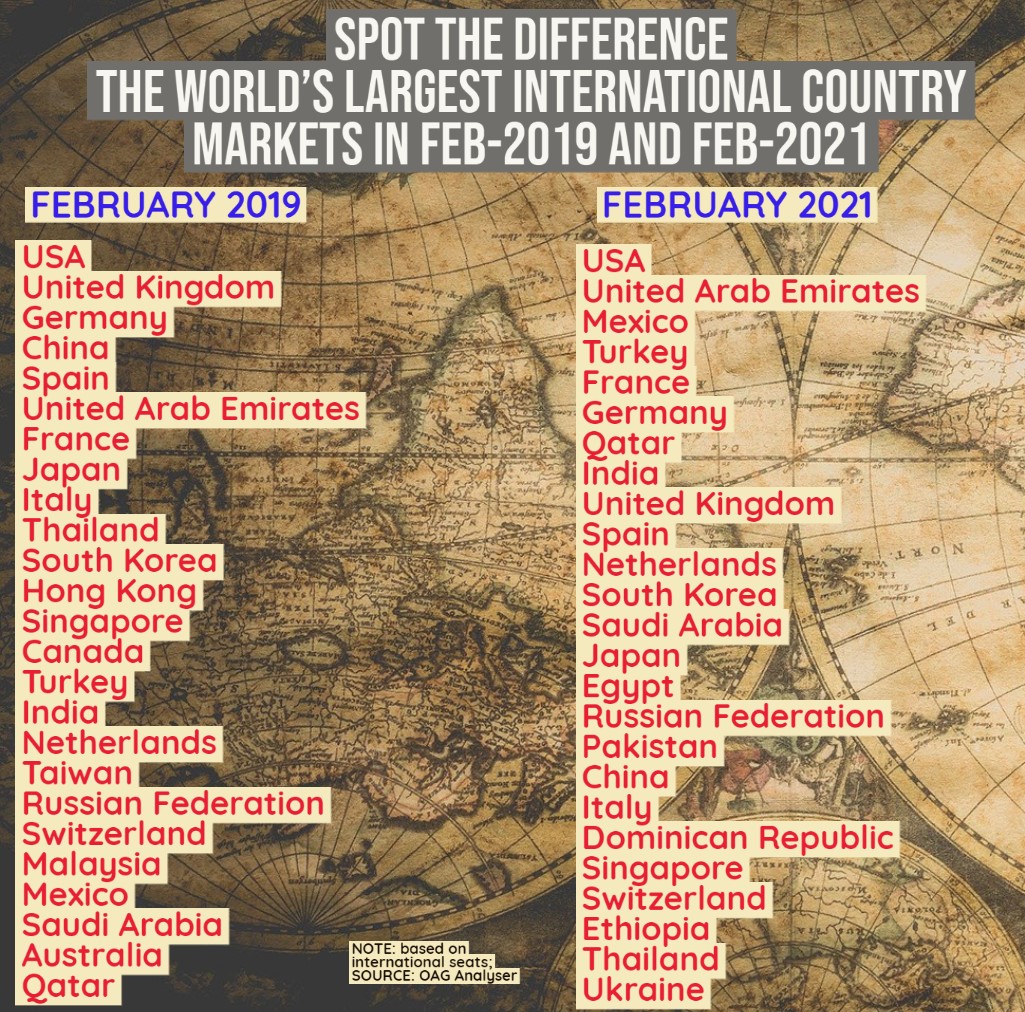
International air connectivity literally fell off a cliff in Mar-2020 as the novel coronavirus leaped across the world and in its early days its impact was significantly under estimated. A snapshot now of international air travel in Feb-2019 and Feb-2021 highlights the scale of the lasting impact. Comparing the same month two years apart, global international air capacity has fallen more than three quarters, down -77.29% from an average of 5.97 million daily seats in Feb-2019 to 1.35 million daily seats in Feb-2021.
The world is not equal and air travel in some countries has been impacted more heavily than others. Looking at the largest country markets by international seats in Feb-2019 and where they sat in Feb-2021, we see some obvious differences. However, the declines are still significant - only two of the world's largest international markets in Feb-2019 have seen declines in capacity of less than half; more (five) have seen declines of over -90% with a further 13 of over -85%.
While USA remains in the top spot, United Kingdom, Germany and Spain slip down the top ten, and France, Germany and Italy down into the wider top 20. Interestingly, China, where domestic recovery has occurred, international capacity was down -93.96% in Feb-2021 pushing it down from 4th to 18th position in the ranking when compared to Feb-2019.
The Gulf states have gained the most. Qatar has risen from being the 25th largest international market in Feb-2019 to the 7th largest in Feb-2021. Meanwhile, United Arab Emirates (UAE) rose from 6th to 2nd place. Other notable climbers into the top ten were Mexico (up from 22nd to 3rd) and India (up from 16th to 8th).
They say 'a picture paints a thousand words'. In this regular section CTC - Corporate Travel Community offers a graphical insight into a key industry observation or trend. In this latest edition we analyse OAG schedule data to illustrate the world's largest international country markets in Feb-2019 and Feb-2021 by departure seats. Can you spot the differences?
This regular section also now incorporates and expands on the charts produced in the 2020 air capacity series 'Coronavirus Statistics Snapshot'. These are based on an analysis of OAG schedule data and include a weekly look at how the pandemic is impacting global flight levels in the world's largest markets; a week-on-week and year-on-year comparison of flight departures by geographical region and a look at how weekly capacity is trending: the latter comparing levels to 2020 and also to the 2019 baseline performance.
HEADLINE FIGURES FOR WEEK COMMENCING 01-Mar-2021:
Departure frequencies up +6.46% versus last week; down -40.37% versus 2020 and down -44.44% versus 2019.
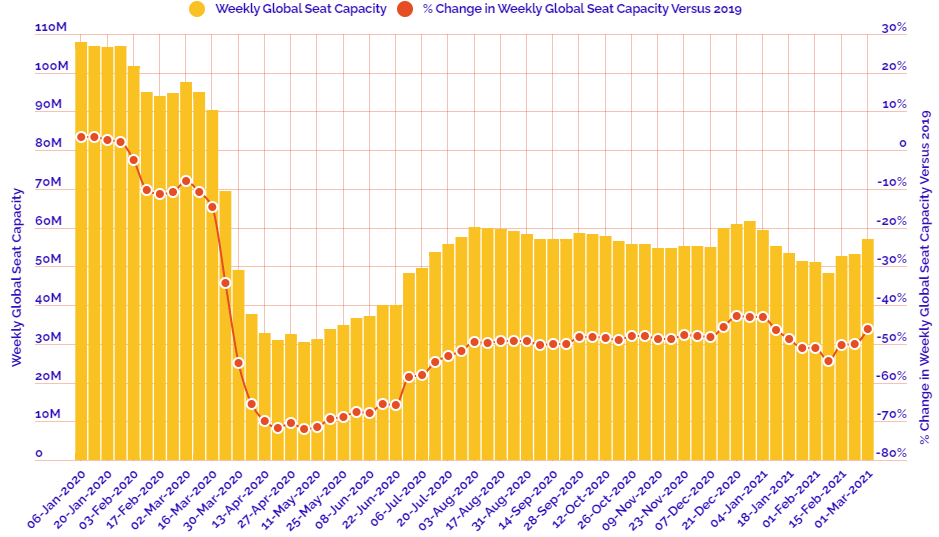
Seat capacity up +7.66% versus last week; down -41.39% versus 2020 and down -46.12% versus 2019.
CHART: Week-on-week change in flight departures by region
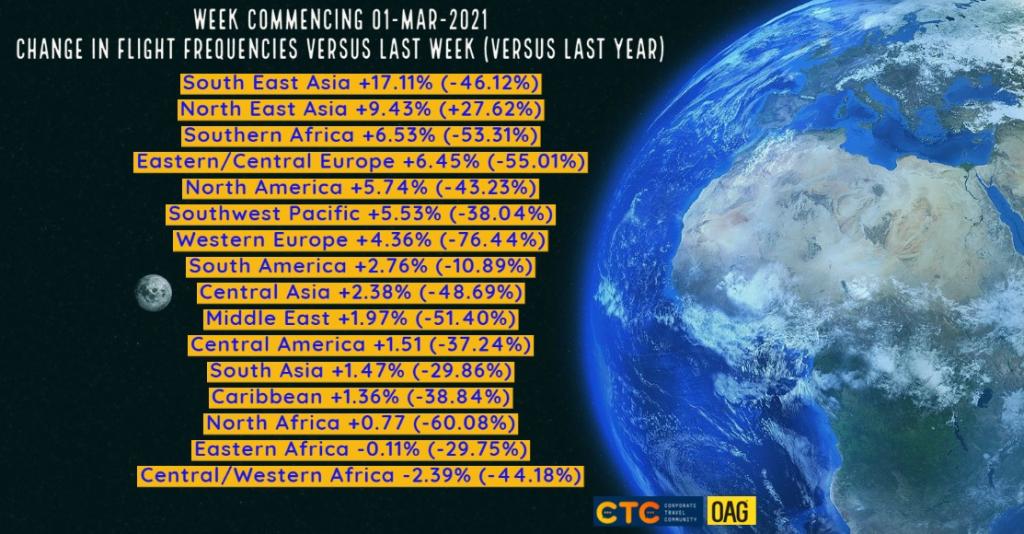
CHART: Year-on-year weekly departure performance for world's top 30 markets versus 2019
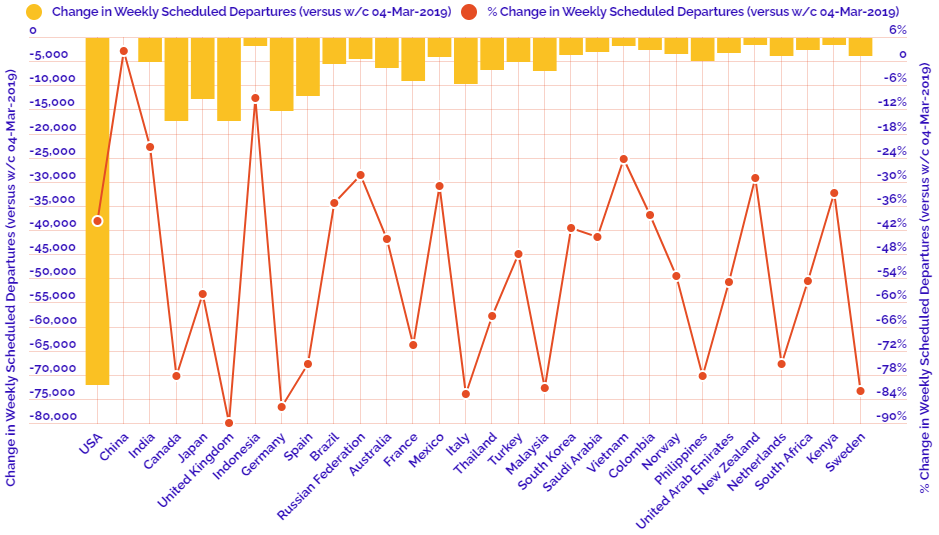
CHART: Year-on-year weekly departure performance for world's top 30 markets versus 2020
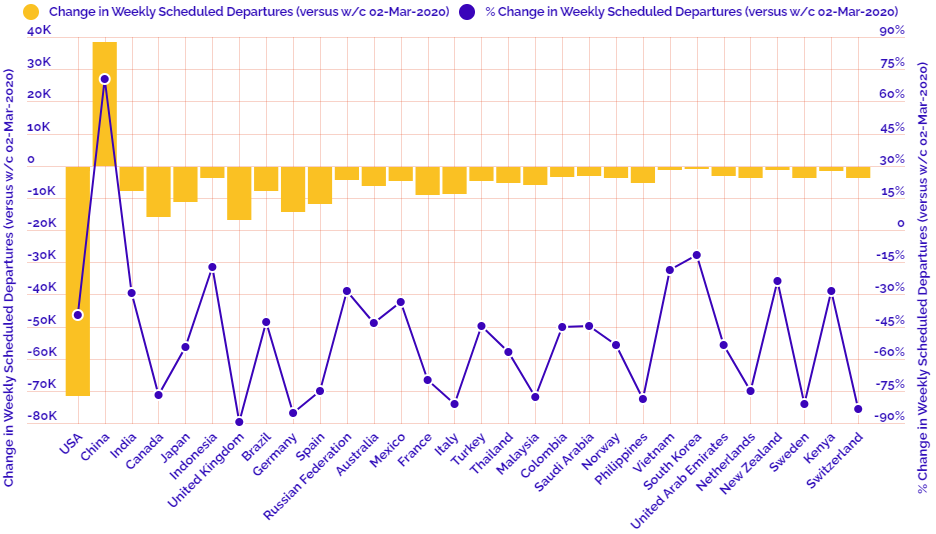
CHART: Departure capacity trends with year-on-year performance
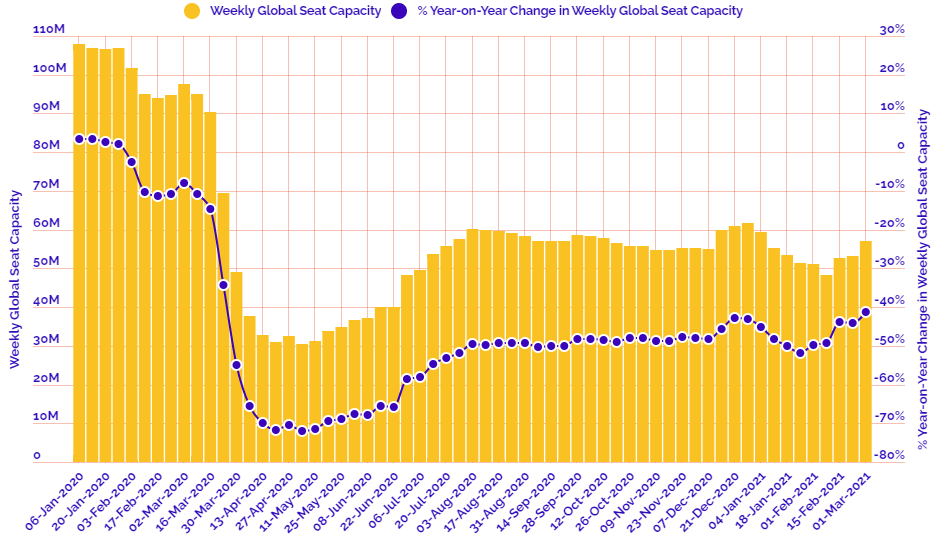
CHART: Departure capacity trends versus 2019