While we are still far from a full recovery for the overall industry, and concerns remain on the recovery of business travel, the leisure market was always going to be the first to rebound and the Oliver Wyman projection paints a more positive picture of the expected recovery.
The rapidly increasing availability of vaccines and economic stimulus from the USD1.9 trillion American Rescue Plan Act are two reasons for the increase in domestic leisure travel in the US. Both factors also happened to coincide with the timing of spring break across many states, which has caused an encouraging spike in demand. Consumers are also looking forward to summer travel, and Oliver Wyman's Pandemic Navigator is now predicting that the US will reach COVID-19 herd immunity (the point when a large part of the population of an area is immune to a specific disease) by mid-Jun-2021 to early Jul-2021, ahead of earlier forecasts.
The findings from Oliver Wyman indicate that in mid-Mar-2021, US travel demand had risen to more than 50% of 2019 levels, the highest it has been on a sustained basis since the start of the pandemic. However, the opposite was true with corporate and international travel, which was still down more than 80% from 2019.
These latter segments of the market are not likely to show a similar recovery before 2023 and the loss of business travel will remain a "real challenge" for some full-service airlines, says Oliver Wyman, because "they depend on high-yielding customers to provide more than half of their profits and a third of revenues in major economies such as the US".
Oliver Wyman's analysis of US Department of Transportation data reveals revenue per available seat mile (RASM) for full-service airlines fell 50% year-on-year in the second quarter of 2020, making it one of the darkest periods for US carriers. Meanwhile, the RASM for low-cost airlines fell 23% in the same three months. The third quarter of 2020 brought the performance of the two airline groups closer together, with full-service carriers declining 45% and low-cost carriers down 38%.
The overall comeback of travel will depend on "how fast nations get their populations vaccinated and standardise their health passport travel protocols and testing regulations." says Mr Stalnaker, but the finding of the report shows that demand to travel "is here and we don't see it going away anytime soon," he adds.
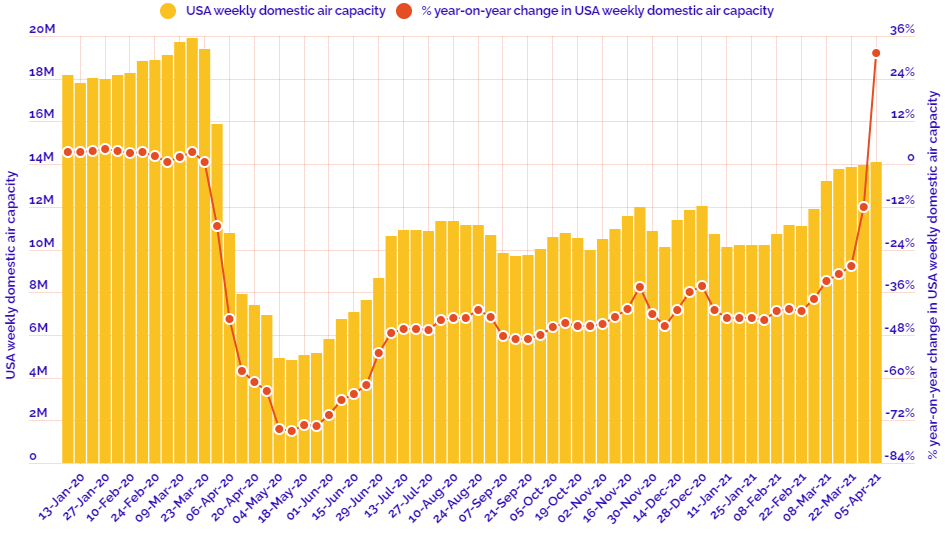
They say 'a picture paints a thousand words'. In this regular section CTC - Corporate Travel Community offers a graphical insight into a key industry observation or trend. Continuing the US recovery theme we look at OAG schedule data to highlight changes in domestic air capacity within the US market since the beginning of 2020.
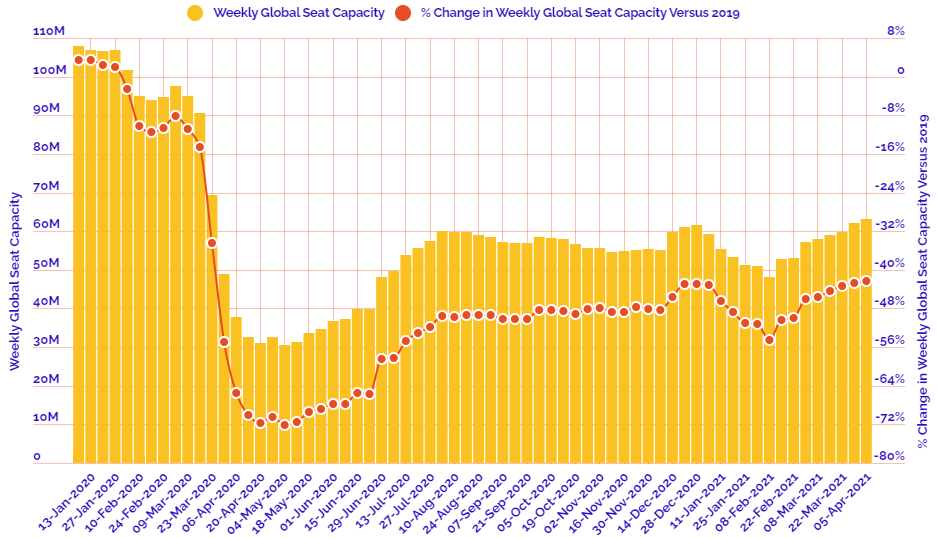
This regular section also now incorporates and expands on the charts produced in the 2020 air capacity series 'Coronavirus Statistics Snapshot'. These are based on an analysis of OAG schedule data and include a weekly look at how the pandemic is impacting global flight levels in the world's largest markets; a week-on-week and year-on-year comparison of flight departures by geographical region and a look at how weekly capacity is trending: the latter comparing levels to 2020 and also to the 2019 baseline performance.
HEADLINE FIGURES FOR WEEK COMMENCING 05-Apr-2021:
Departure frequencies up +1.82% versus last week; up+51.10% versus 2020 and down -41.16% versus 2019.
Seat capacity up +1.80% versus last week; up +67.28% versus 2020 and down -42.24% versus 2019.
CHART: Week-on-week change in flight departures by region
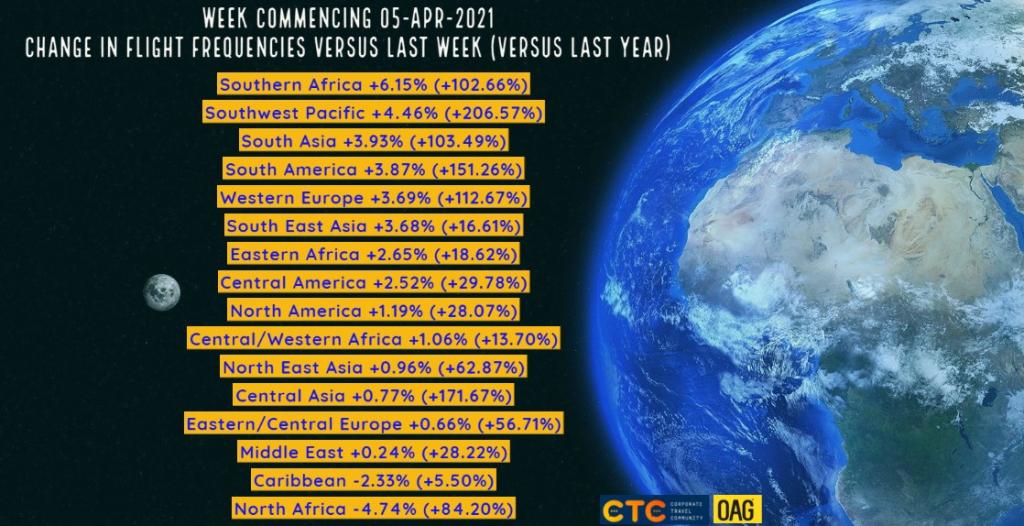
CHART: Year-on-year weekly departure performance for world's top 30 markets versus 2019
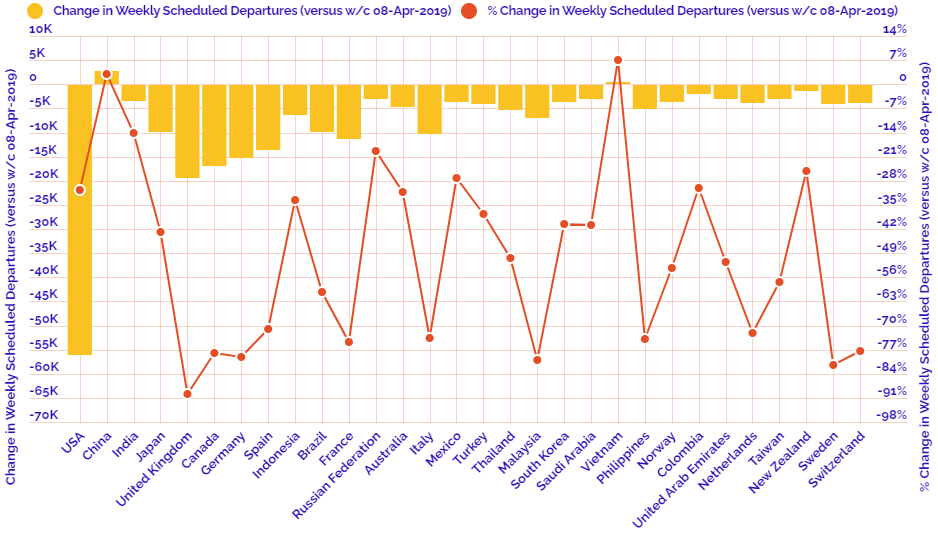
CHART: Year-on-year weekly departure performance for world's top 30 markets versus 2020
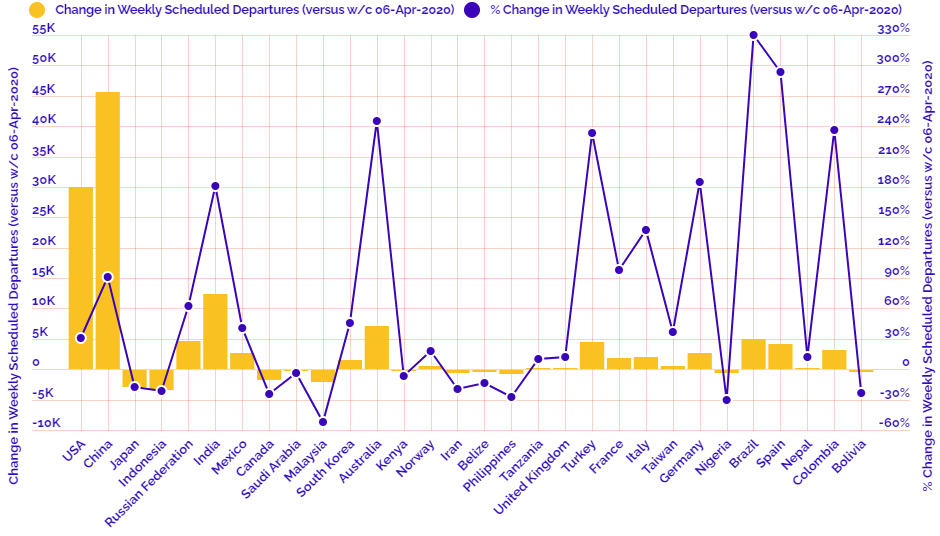
CHART: Departure capacity trends with year-on-year performance
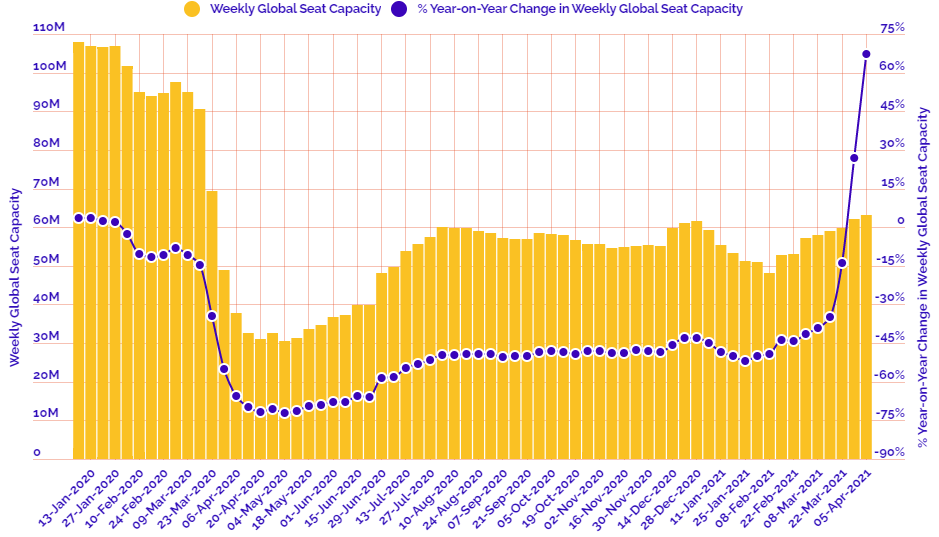
CHART: Departure capacity trends versus 2019