This regular section also now incorporates and expands on the charts produced in the 2020 air capacity series 'Coronavirus Statistics Snapshot'. These include a weekly look at how the pandemic is impacting global flight levels in the world's largest markets; a week-on-week and year-on-year comparison of flight departures by geographical region and a look at how weekly capacity is trending: the latter comparing levels to 2020 and also to the 2019 baseline performance.
HEADLINE FIGURES FOR WEEK COMMENCING 04-Jan-2021:
Departure frequencies down -3.51% versus last week; down -43.26% versus 2020 and down -42.04% versus 2019.
Seat capacity down -3.94% versus last week; down -45.07% versus 2020 and down -43.15% versus 2019.
CHART: Week-on-week change in flight departures by region
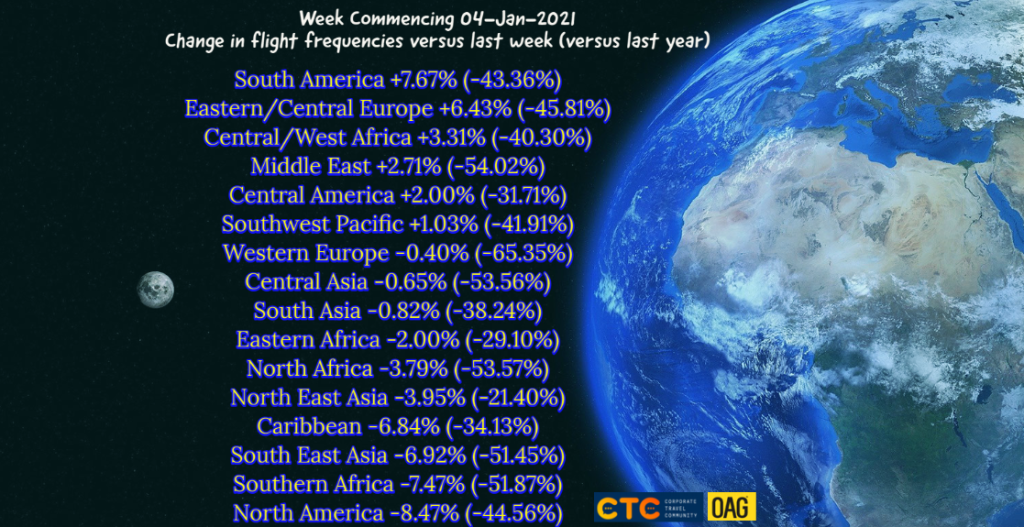
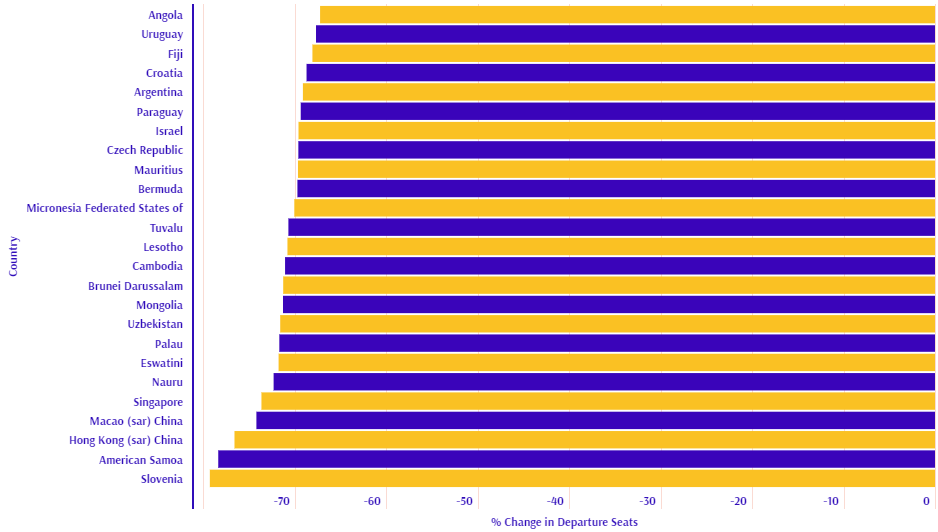
CHART: Year-on-year weekly departure performance for world's top 30 markets versus 2019
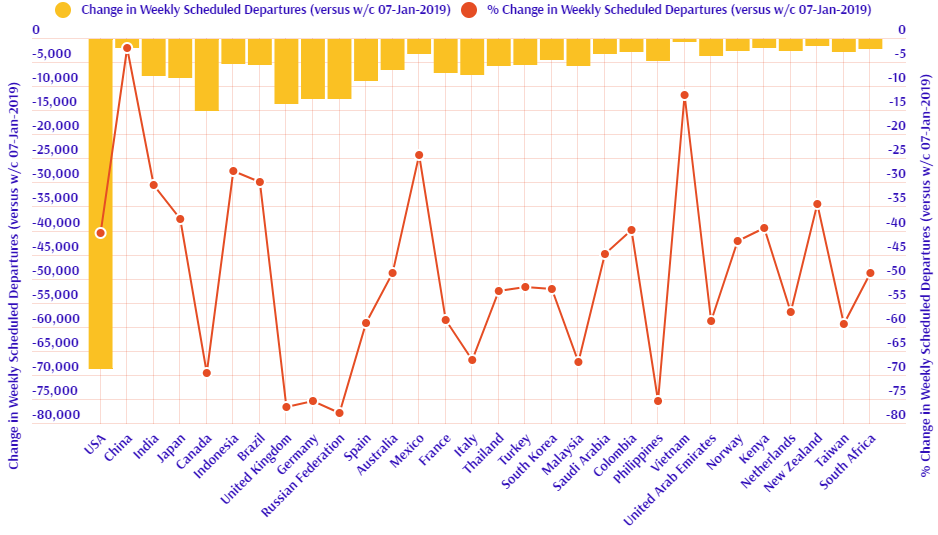
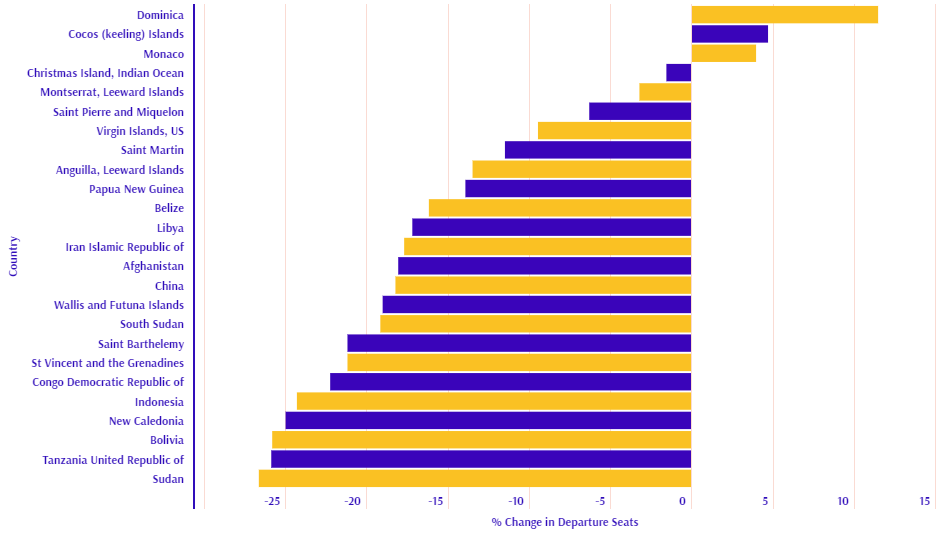
CHART: Year-on-year weekly departure performance for world's top 30 markets versus 2020
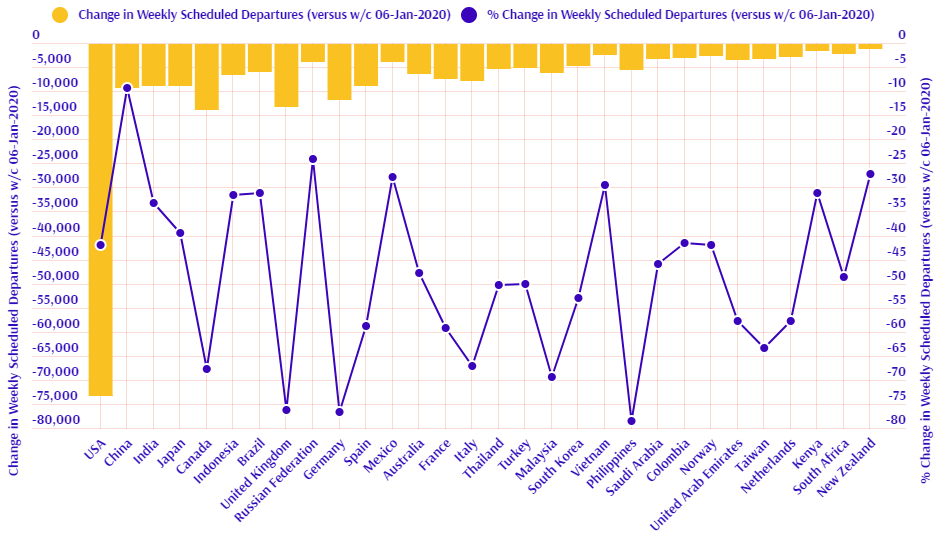
CHART: Departure capacity trends with year-on-year performance
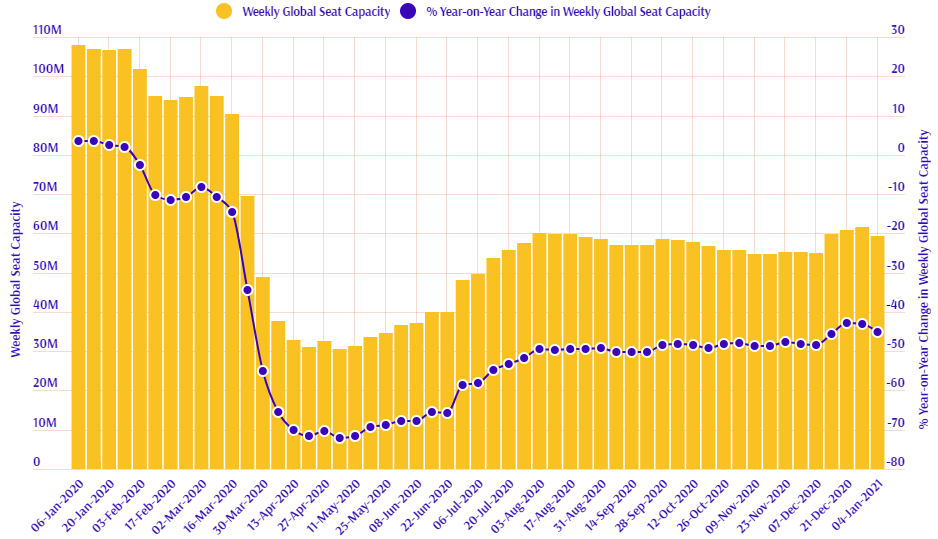
CHART: Departure capacity trends versus 2019
