International passenger demand in Oct-2020 was down -87.8% compared to Oct-2019, virtually unchanged from the -88.0% year-to-year decline recorded in Sep-2020. Capacity was -76.9% below previous year levels, and load factor shrank 38.3 percentage points to 42.9%.
Domestic demand continues to drive what little recovery there is, with Oct-2020 domestic traffic down -40.8% compared to the prior year. This was improved from a -43.0% year-to-year decline in Sep-2020. Capacity was -29.7% below 2019 levels and the load factor dropped 13.2 percentage points to 70.4%.
The pace of recovery is faster in some regions than others, but the overall picture for international travel remains "grim," says IATA's director general and CEO. But while domestic travel is leading the way, the uneven recovery is actually more pronounced with some countries having nearly recovered, while many others remain deeply depressed.
IATA's Oct-2020 data shows China's domestic traffic was down just -1.4% in Oct-2020 compared to October a year ago. The domestic economy was close to normality and low fares and so-called 'all you can fly' deals boosted demand. Russia had seen positive growth in its domestic market, but traffic slipped back into negative numbers in Oct-2020, down -10% after two months of growth as new COVID cases have taken their toll on travellers' confidence, despite few domestic travel restrictions.
Domestic RPKs in Brazil and Japan both improved significantly in Oct-2020, with annual declines of -44.5% and -45.3%, respectively. Some domestic restrictions have now been lifted in Australia and will help its recovery, but that will not start to be visible until the Nov-2020 data is released early next year. Domestic markets are clearly much stronger than international and IATA's data shows that load factors have shown encouraging growth since Apr-2020 when international levels have started deteriorating again after an initial rise.
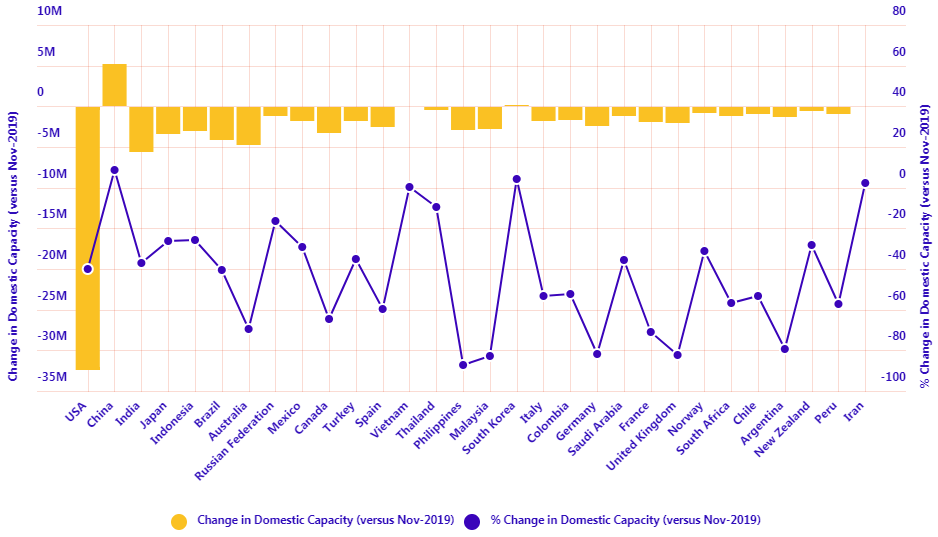
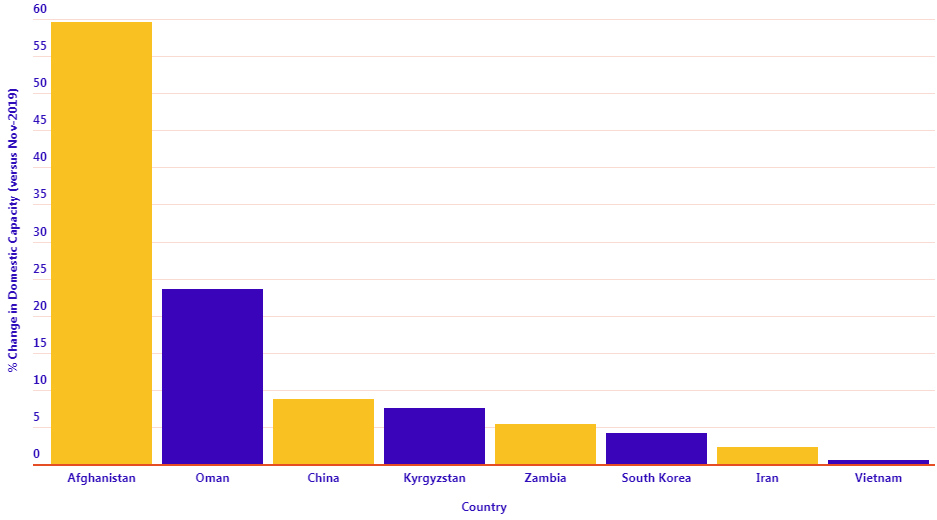
They say 'a picture paints a thousand words'. In this new regular section CTC - Corporate Travel Community offers a graphical insight into a key industry observation or trend. In this latest edition we use OAG schedule data to explore the recovery of domestic capacity over 2020 and highlight some of the strongest and weakest performers in Nov-2020.