This has meant that the country in southeastern Europe - formed of thousands of islands throughout the Aegean and Ionian seas - has had a lot to lose from the Covid-19 pandemic, but also a lot to gain from the leisure-focussed demand that is leading the recovery across Europe.
Data from the World Travel & Tourism Council (WTTC) shows that the Greek travel and tourism sector represents more than one fifth of Greek GDP, almost double the global average. Put simply, this means that one in every five Euros that is spent in Greece comes from a travel and tourism sector, worth approaching EUR40 billion annually. One quarter of all employment in Greece is based in travel and tourism - equivalent to around one million jobs.
In spring, Greece fared better than many other countries in controlling the spread of Covid-19 mainly due to targeted lockdowns followed by nationwide curbs imposed during Mar-2020. The country has seen a quick uplift in demand as travel restrictions have eased in Europe, but a recent spike in cases means that infection levels are back as high as last seen back in Apr-2020 and localised restrictions have again been introduced in the past week that threatens to undo the country's relative success in containing the pandemic so far.
Right now is the annual peak in demand which generally exceeds six million arrivals in Aug-2020 compared to less than one million for almost half the year. The country's reliance on travel and tourism means that its economy will shrink notably this year, perhaps by as much as 10%. Greece has proven its resilience in its recovery from its own financial crisis in the late 2000s, but will be anxious that a further spike in Covid-19 infections could do it more serious economic harm.
AIRPORTS IN THE COUNTRY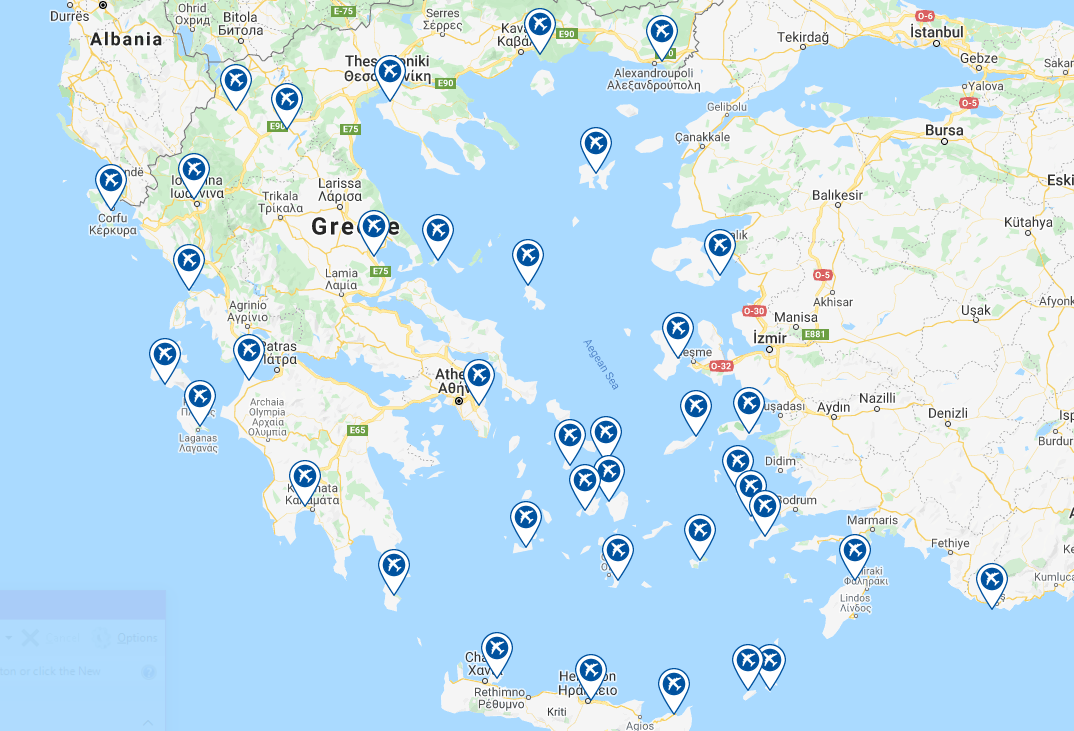
ANNUAL VISITOR ARRIVALS (2010 - 2020YTD)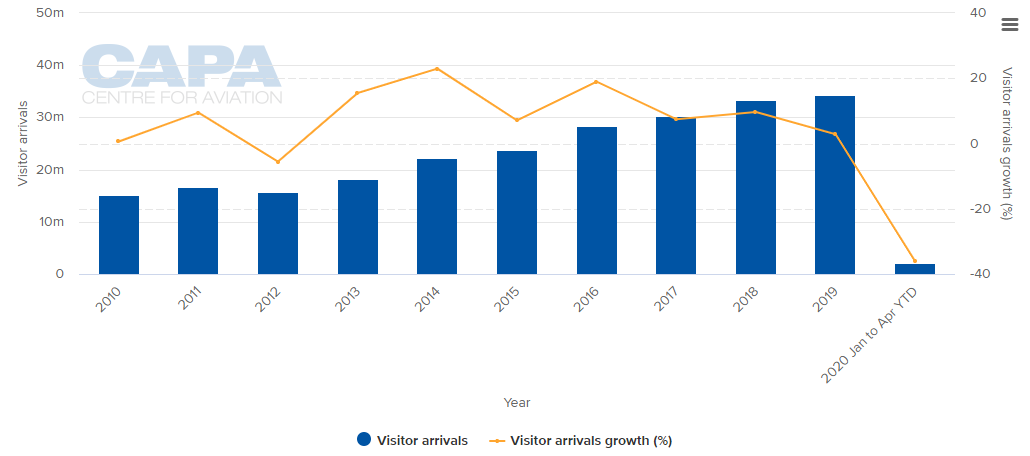
VISITOR ARRIVALS BY MARKET (2019)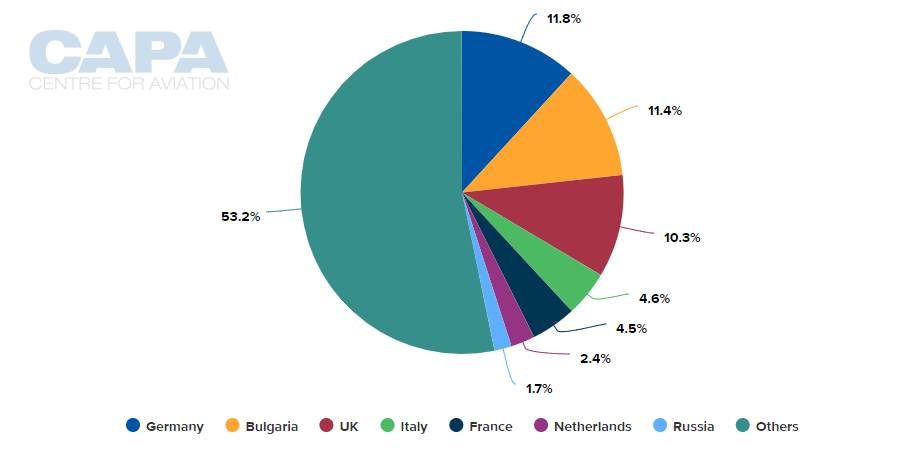
MONTHLY VISITOR ARRIVALS AND SEASONALITY IN DEMAND (2015 - 2020)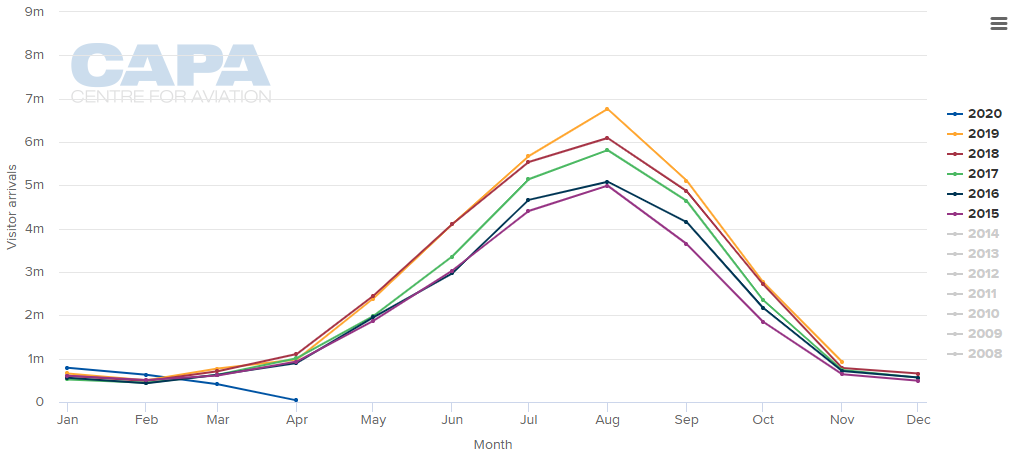
SCHEDULE MOVEMENT SUMMARY (w/c 17-Aug-2020)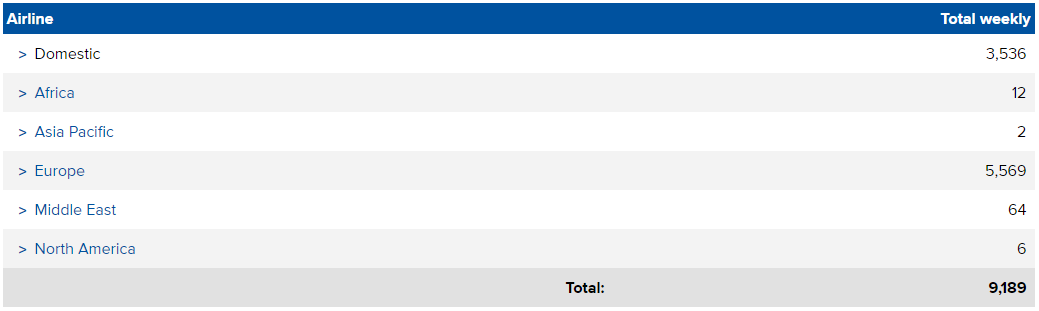
ANNUAL CAPACITY (2012 - 2021*)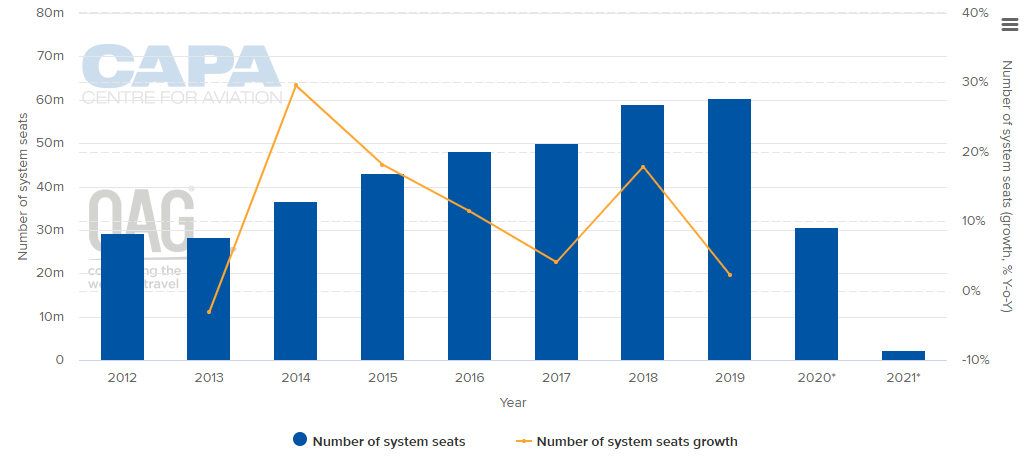 NOTE:*the values for this year are at least partly predictive up to six months and may be subject to change.
WEEKLY DOMESTIC CAPACITY (2017 - 2020*)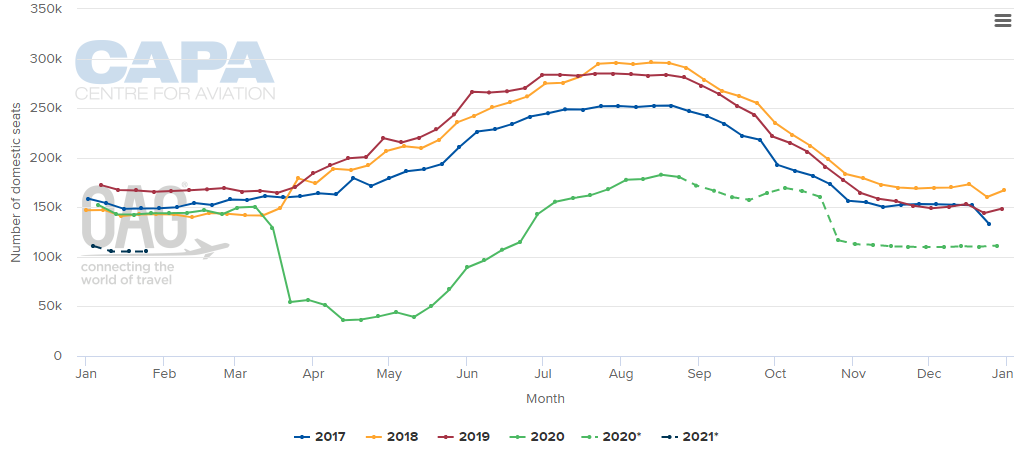 NOTE:*the values for this year are at least partly predictive up to six months and may be subject to change.
WEEKLY INTERNATIONAL CAPACITY (2017-2020*)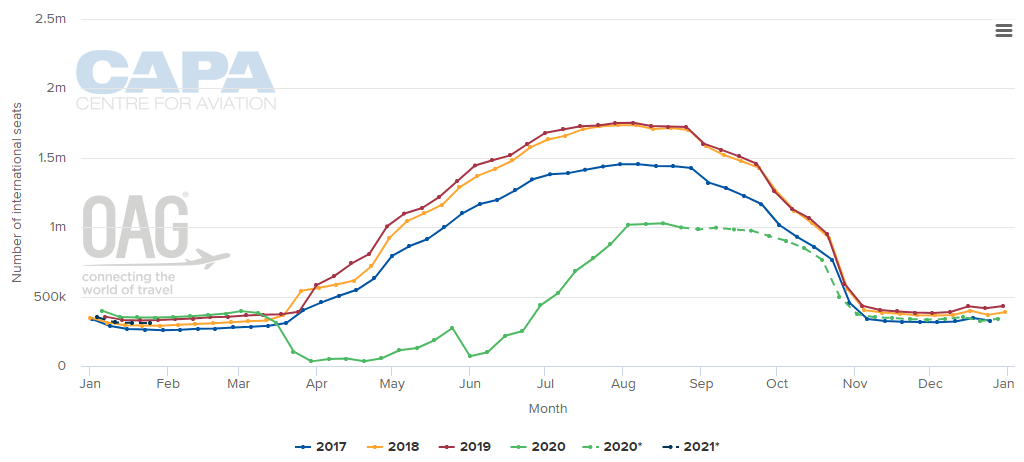 NOTE:*the values for this year are at least partly predictive up to six months and may be subject to change.
CAPACITY SPLIT BETWEEN DOMESTIC AND INTERNATIONAL OPERATIONS (w/c 17-Aug-2020)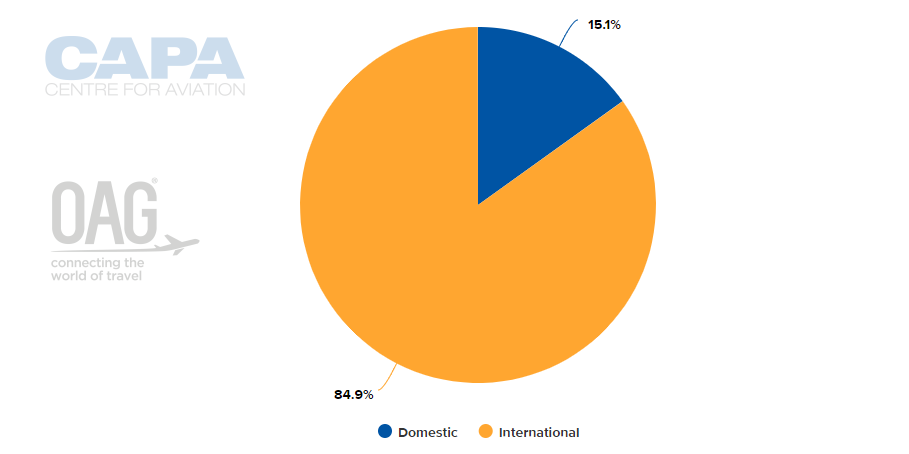
LARGEST AIRLINES BY CAPACITY (w/c 17-Aug-2020)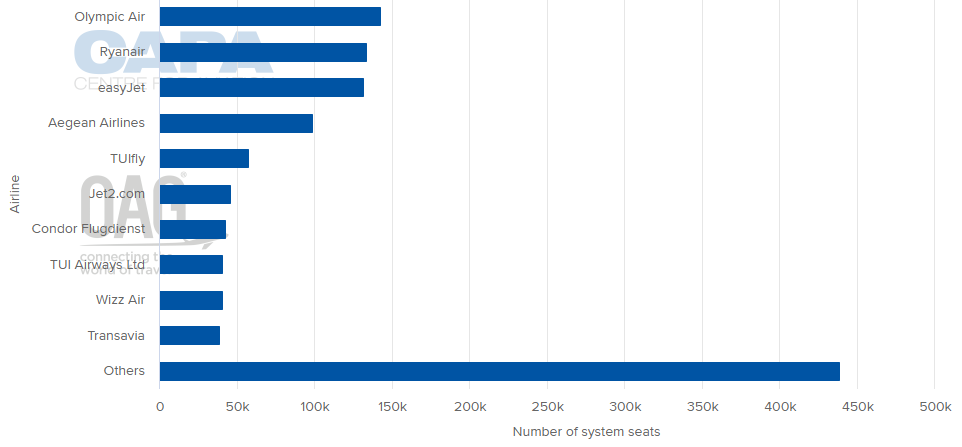
CAPACITY SPLIT BETWEEN LOCAL AND FOREIGN OPERATORS (w/c 17-Aug-2020)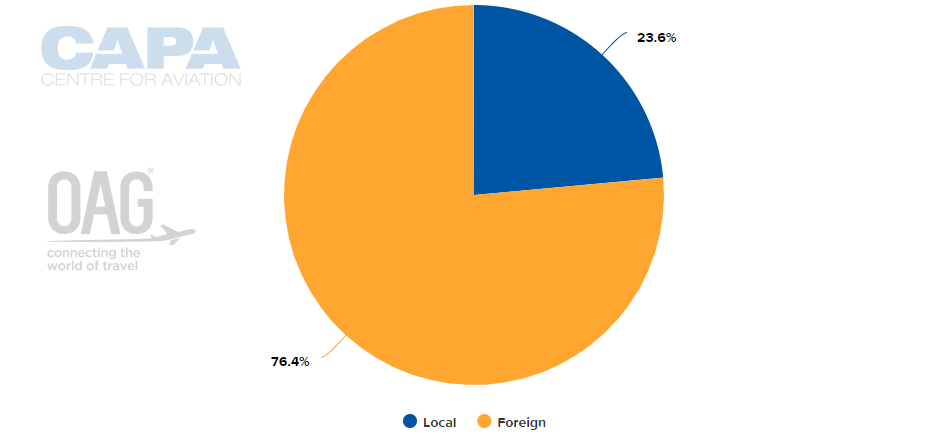
AIRLINE BUSINESS MODEL CAPACITY SPLIT (w/c 17-Aug-2020)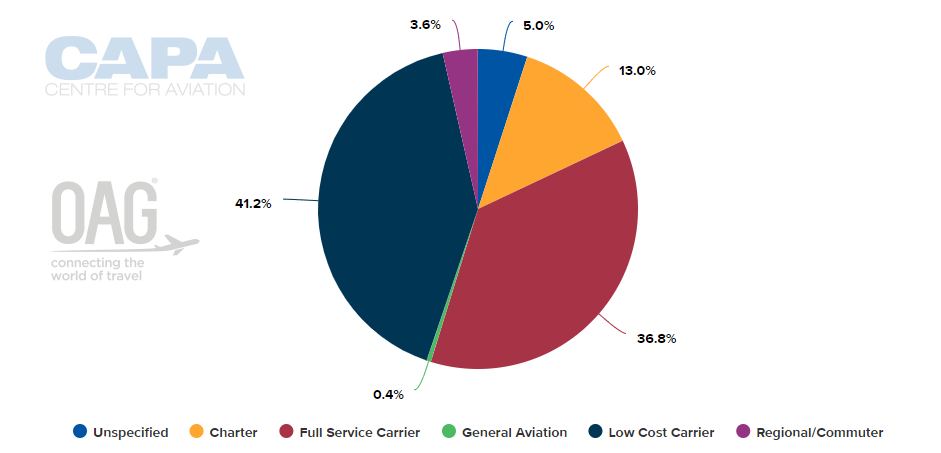
DEVELOPMENT OF LCC ACTIVITY IN COUNTRY (2009 - 2019)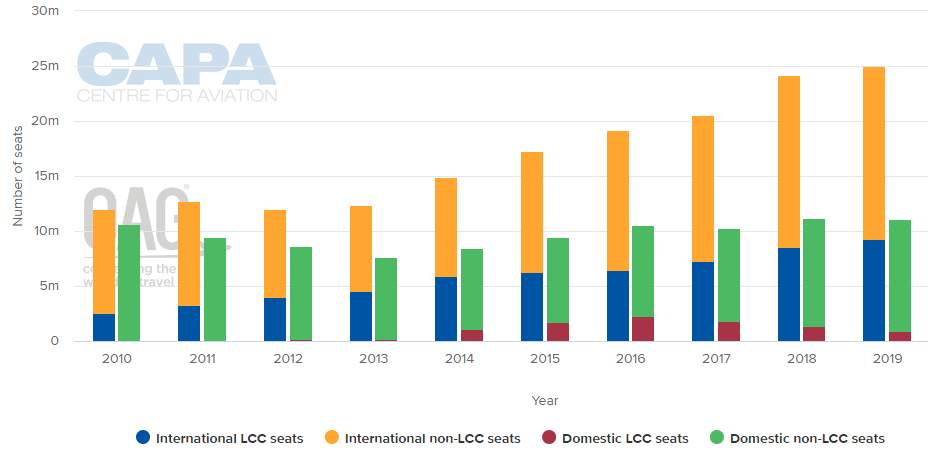
ALLIANCE CAPACITY SPLIT (w/c 17-Aug-2020)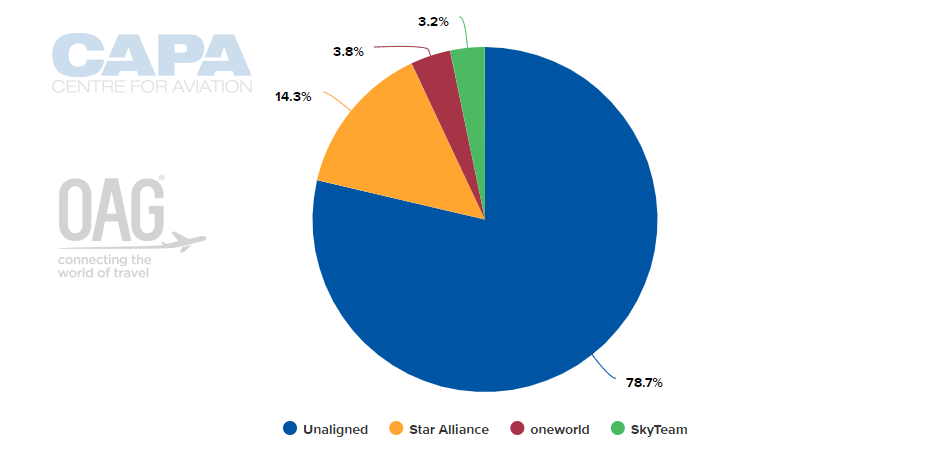
INTERNATIONAL CAPACITY BREAKDOWN BY COUNTRY (w/c 17-Aug-2020)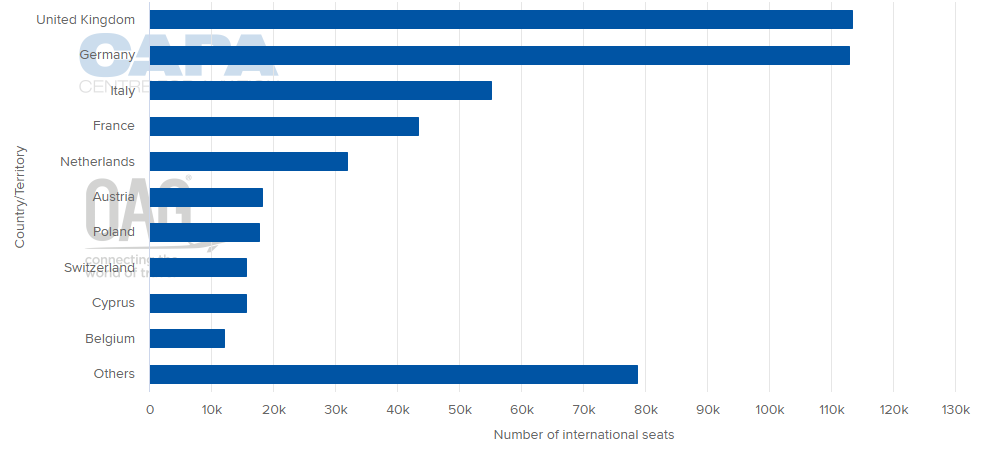
DEPARTING SYSTEM SEATS BY CLASS (w/c 17-Aug-2020)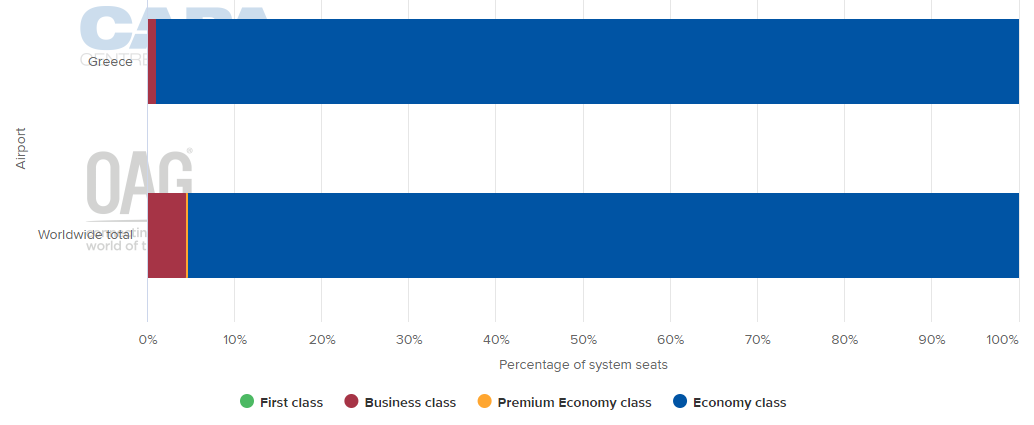
BUSIEST DOMESTIC MARKETS BY CAPACITY (w/c 17-Aug-2020)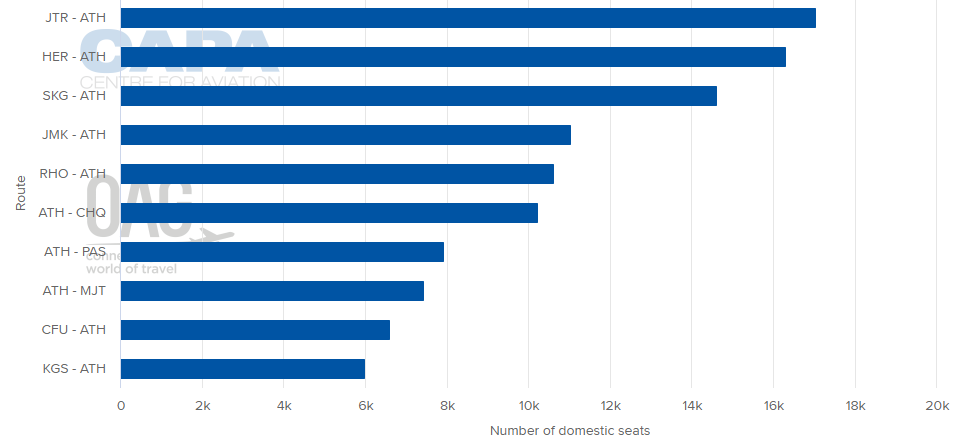
BUSIEST INTERNATIONAL MARKETS BY CAPACITY (w/c 17-Aug-2020)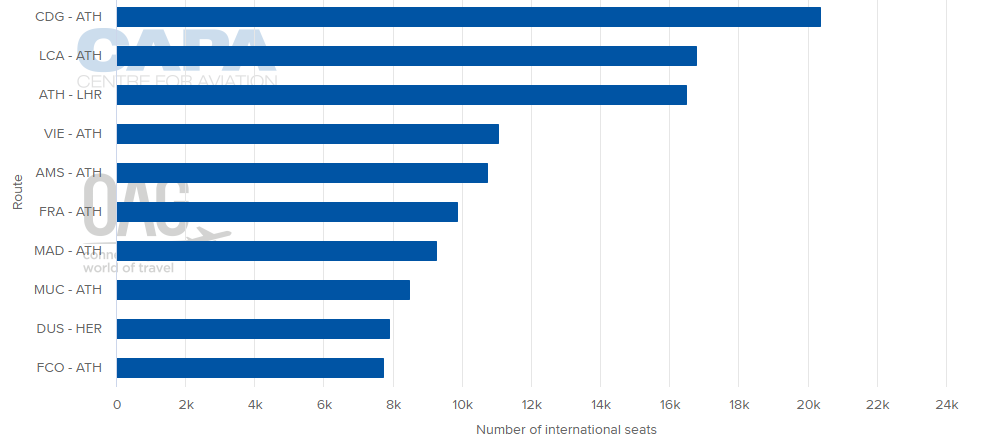
LOCAL AIRLINES' AIRCRAFT FLEET (as at 17-Aug-2020)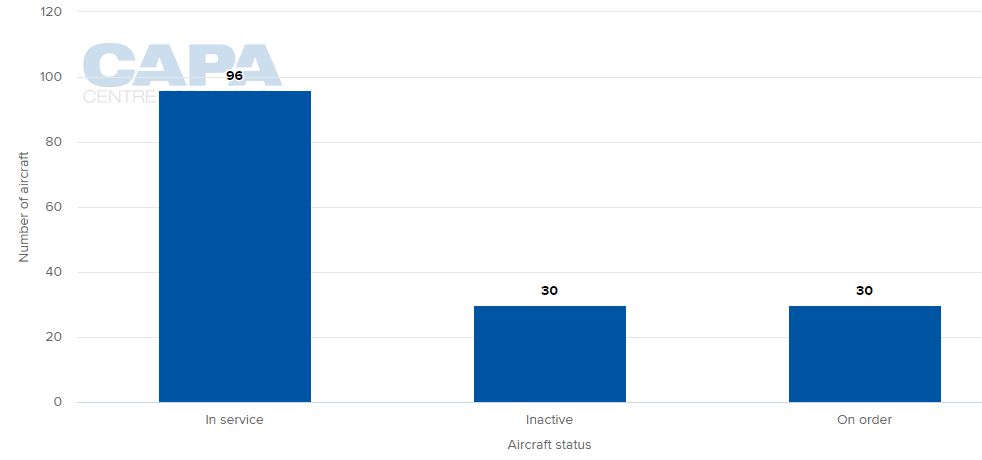
MORE INSIGHTS:
European airline capacity planning: uncertainty is increasing