The major west coast USA hub has confirmed that from 01-Apr-2020 all flights using its international terminal will depart from a single concourse, Boarding Area G, with Boarding Area A, which contains This consolidation, which is due to provisionally last until the end of May-2020, will allow the airport to close a security checkpoint and consolidate Customs & Border Protection (CBP) to a single point of entry for international arrivals.
It will also improve passenger connectivity, as Boarding Area G is connected to Domestic Terminal 3 through a post-security connecting walkway, while airport users will have greater access to essential services within the airport, including food & beverage. Although Boarding Area A will be closed, the Grand Hyatt at SFO and International Parking Garage A will remain open.
In the recent days, an average of less than 12 flights per day have departed from Boarding Area A as international flights at the airport have now more than halved against planned levels. Alongside this consolidation airport officials confirmed in Mar-2020 that the opening of the next phase of the Harvey Milk Terminal 1 will be postponed and will not be activated for public relief for at least four weeks.
ABOUT
San Francisco International Airport is the major international gateway to San Francisco, and the largest airport serving in California's Bay Area. Hosting domestic, regional and international passenger and cargo services for over 30 airlines, the airport is a major hub for United Airlines.
GLOBAL RANKING (as at 30-Mar-2020)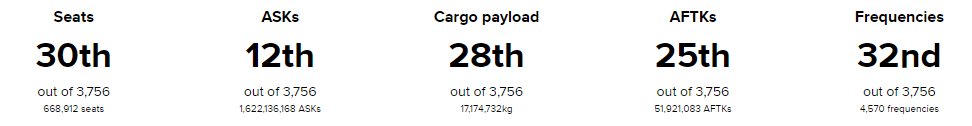
NETWORK MAP (as at 30-Mar-2020)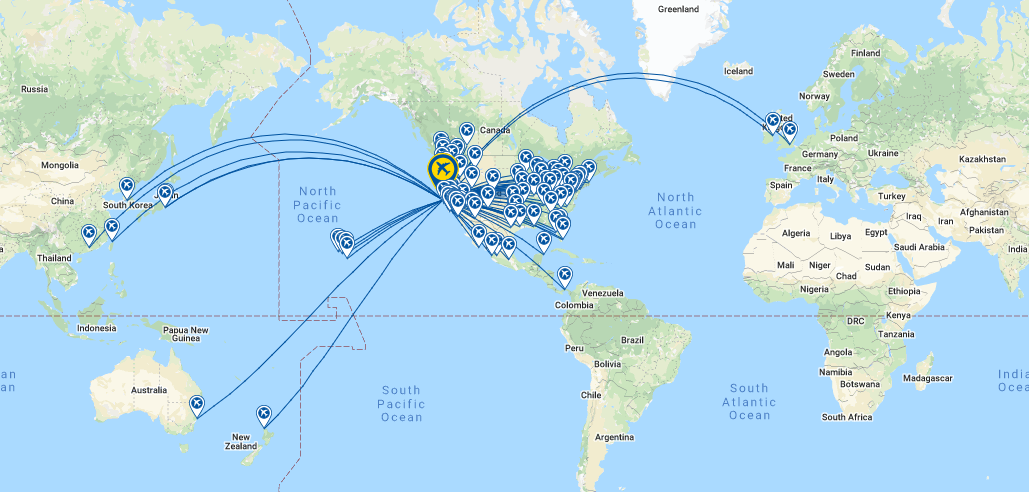
DESTINATIONS (as at 30-Mar-2020)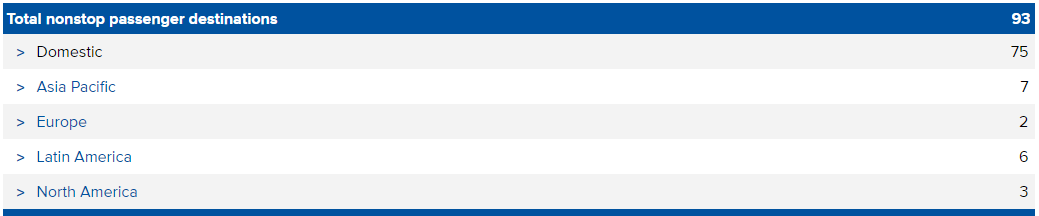
ANNUAL PASSENGER TRAFFIC (2010 - 2020YTD)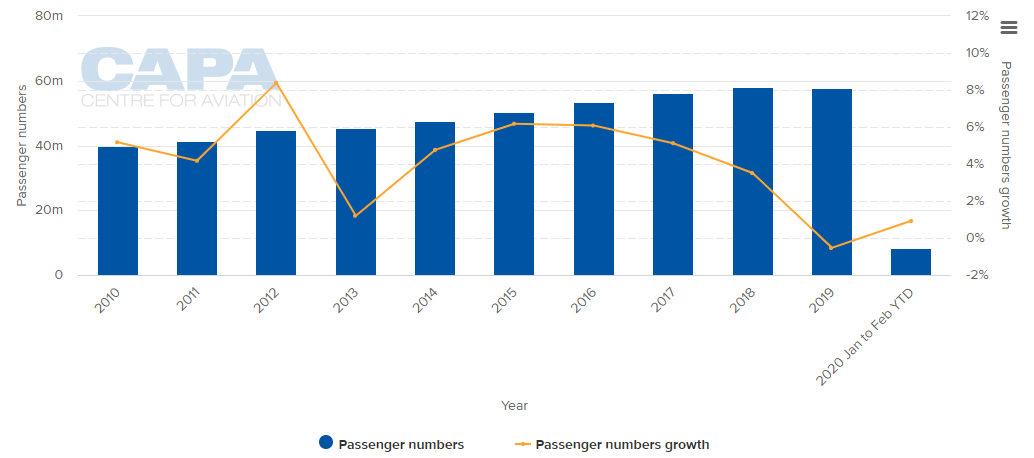
MONTHLY PASSENGER TRAFFIC AND SEASONALITY IN DEMAND (2015 - 2020YTD)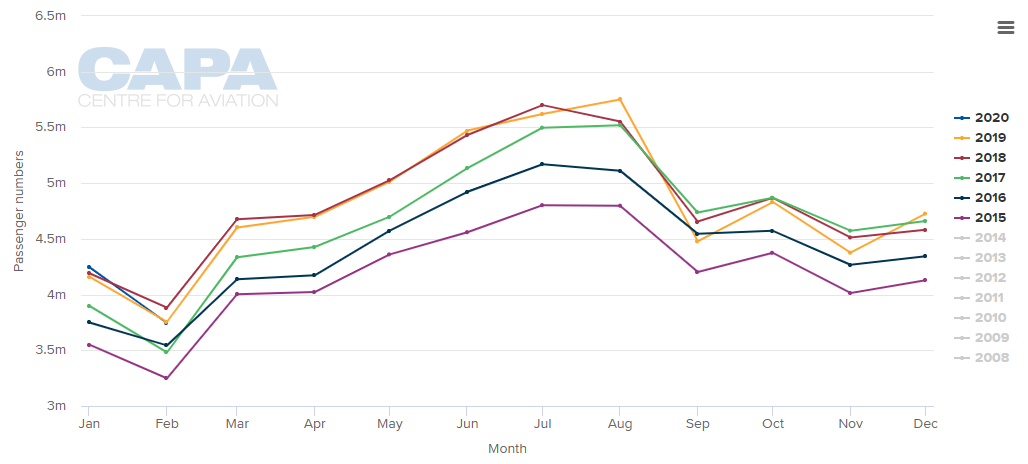
ANNUAL CAPACITY (2012-2020*)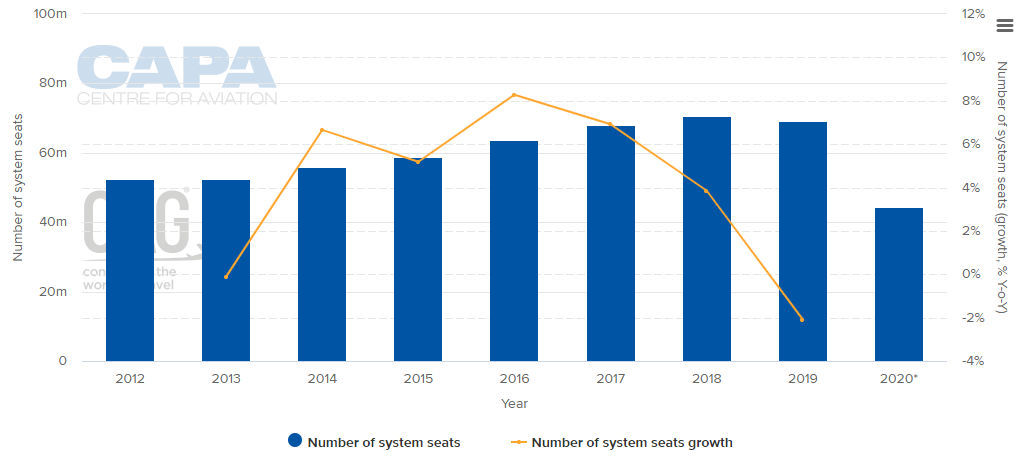 (NOTE:The values for this year are at least partly predictive up to 6 months and may be subject to change)
WEEKLY DOMESTIC CAPACITY (2017 - 2020*)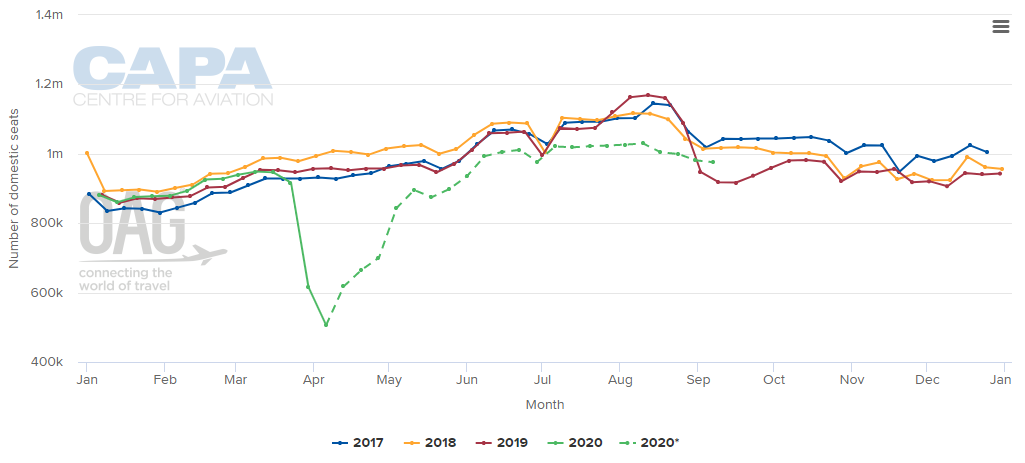 NOTE:*the values for this year are at least partly predictive up to six months and may be subject to change.
WEEKLY INTERNATIONAL CAPACITY (2017-2020*)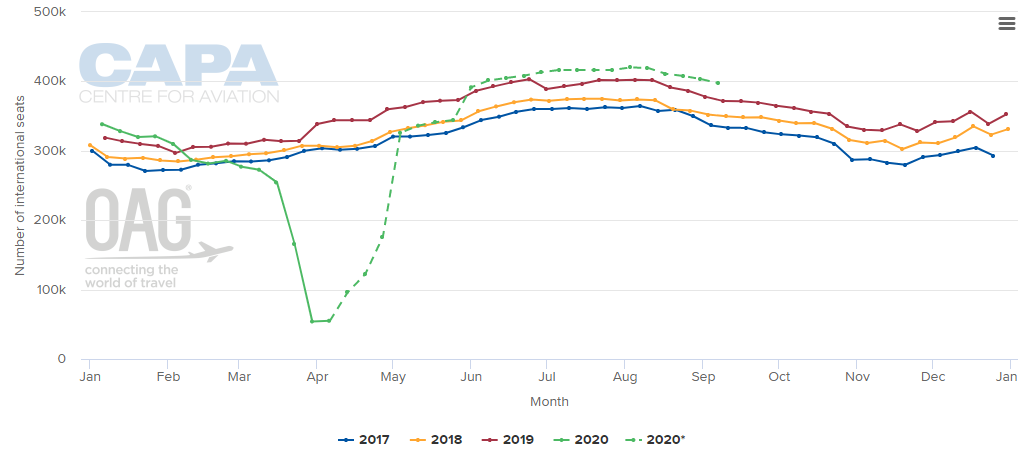 NOTE:*the values for this year are at least partly predictive up to six months and may be subject to change.
CAPACITY SPLIT BETWEEN DOMESTIC AND INTERNATIONAL OPERATIONS (w/c 30-Mar-2020)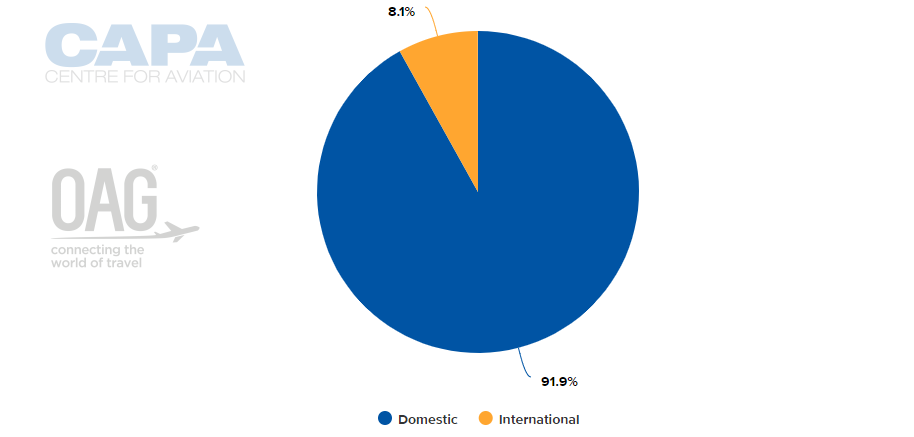
LARGEST AIRLINES BY CAPACITY (w/c 30-Mar-2020)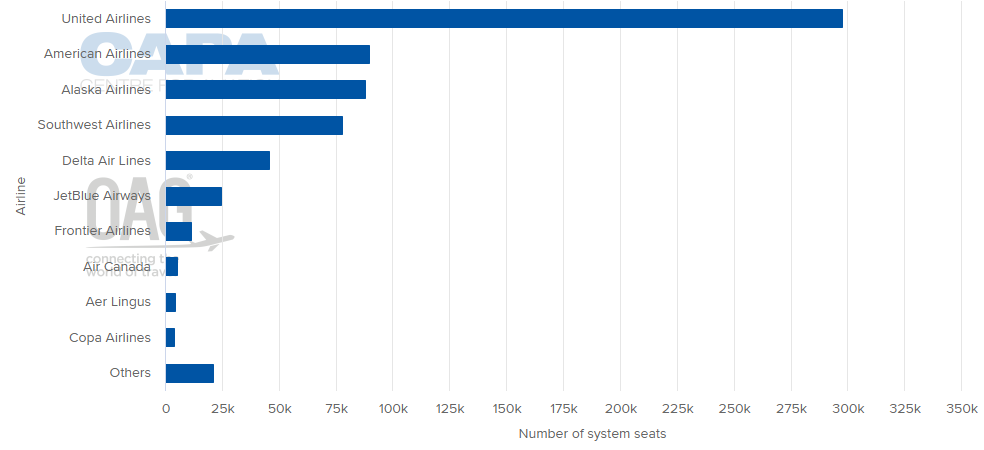
LARGEST DOMESTIC DESTINATION MARKETS (w/c 30-Mar-2020)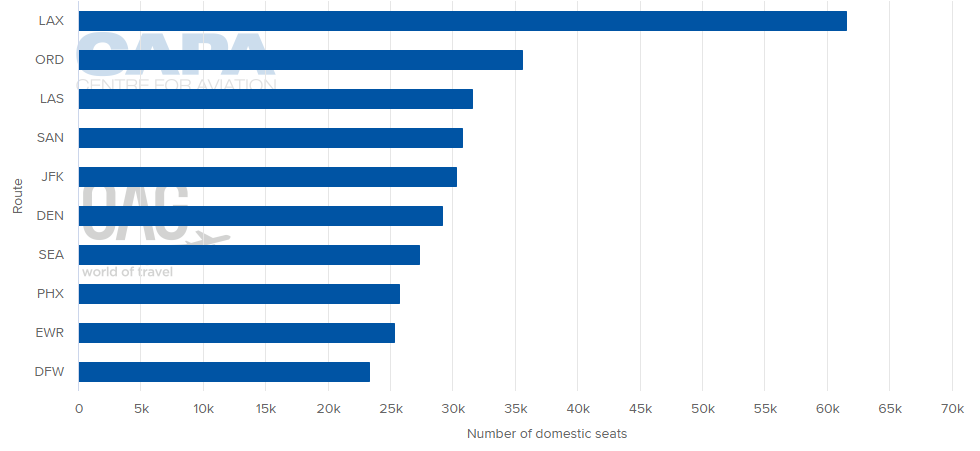
LARGEST INTERNATIONAL DESTINATION MARKETS (w/c 30-Mar-2020)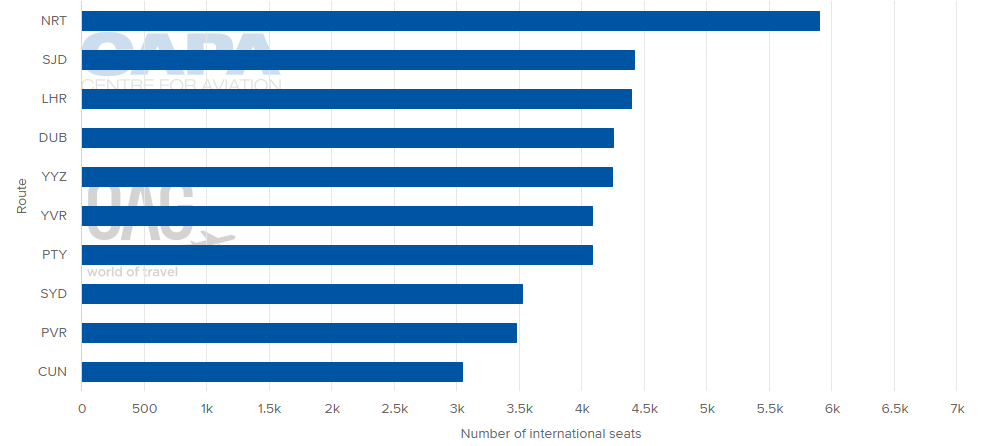
AVERAGE FLIGHT LENGTH (w/c 30-Mar-2020)
AIRLINE BUSINESS MODEL CAPACITY SPLIT (w/c 30-Mar-2020)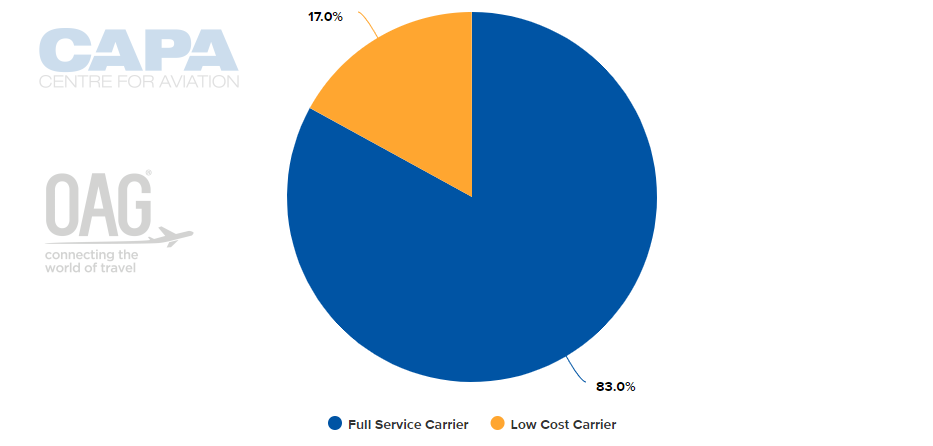
ALLIANCE CAPACITY SPLIT (w/c 30-Mar-2020)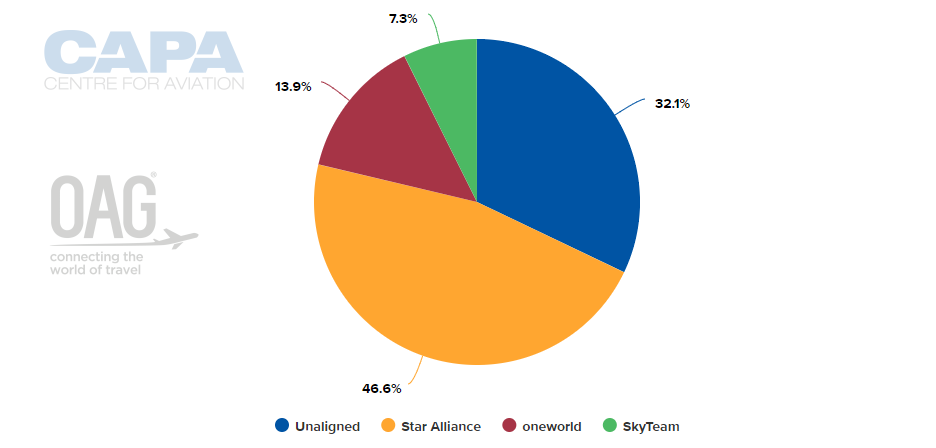
INTERNATIONAL MARKET CAPACITY BREAKDOWN BY REGION (w/c 30-Mar-2020)
AIRCRAFT OPERATIONS BY MOVEMENTS (w/c 30-Mar-2020)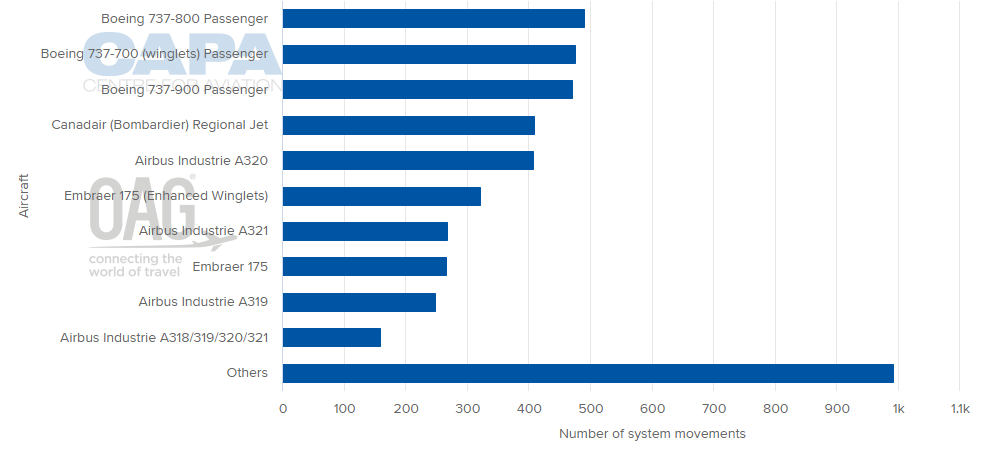
MORE INSIGHTS...
American and Alaska Airlines breathe fresh air into US competition
US airlines brace for fallout from intensifying coronavirus
North Atlantic aviation market growth: smaller airports benefit