From an Air Service Development perspective a number of factors underpin air connectivity, ranging from geographical location and airport infrastructure to airline business models and consumer preference, albeit regulatory and economic frameworks within individual countries ultimately control the effectiveness of all air service development decisions.
Historically, hubs have been formed around the world based around network carrier models with radial spokes providing feed into its operations. These can be in markets that have their own strong local traffic flows, but can also pretty much exist mainly as transfer points as has been increasingly seen in the Middle East.
More recently, Low Cost Carriers (LCCs) have emerged with initially a mainly leisure focussed point-to-point network providing connectivity between mainly secondary airports. However, the divide has become increasingly blurred nowadays as LCCs have move to attract more high-yield traffic and serve more major airports.
For an airport finding that right airline mix can be hard. For smaller regional facilities a single based operation can deliver significant network opportunities but could ultimately restrict future growth by alienating other operators. At a major hub airport a major partner may deliver scale but non-aligned carriers can find markets hard to develop and generally face lower yield returns from competing against Sixth Freedom flows and lower frequency. In an industry where we are never far away from the next round of consolidation and not exempt from big name failures - Sabena, Swissair; Alitalia and airberlin on the brink and most recently the collapse of Monarch Airlines - it is a major and critical decision for airports.
The Blue Swan Daily analysis last month of the Monarch Airlines network (see 'INSIGHT: Route opportunities and fleet developments… what does the collapse of Monarch Airlines mean from a network perspective?') highlighted how the airline's collapse had been worst felt by Birmingham and Leeds Bradford airports in the UK and Gibraltar and Zagreb abroad. This has led us to look more closely at the airport-airline dynamic and how this differs between the leading airports across the globe. Which airports are most reliant upon their hub airline to deliver passengers, while which markets see the most variety among airline operations?
The Blue Swan Daily, in partnership with MIDAS Aviation, across this week will deliver the findings into an analysis of the world's 'Top 100' airports by capacity, highlighting differences in airport approaches to route development, passenger profile trends between different destinations, those airports that have the most reliance upon a single airline partner and those that have the biggest diversity of airline partners.
Today, we look at which of the world's 'Top 100' airports have the largest and smallest percentage shares from their dominant airline partner.
Osaka, Tokyo, Chongqing, Manchester and Los Angeles home to airports that have the smallest share of capacity held by their largest airline partner
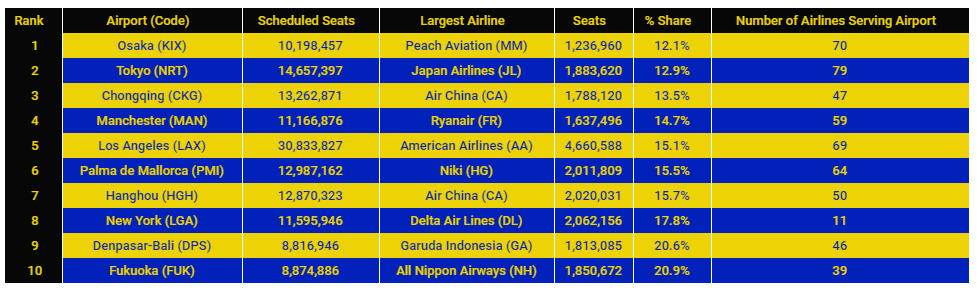
Our analysis of OAG schedule data for the current summer 2017 schedule at the world's 'Top 100' airports by departure shows that Osaka Kansai International in Japan has the least dominant leading airline at the facility with Peach Aviation holding just a 12.1% share of the airport's departure seats. It is one of 70 airlines that have served the airport this summer.
The Asian country is also home to the second ranked airport with Japan Airlines the leading carrier at Narita International Airport in the capital Tokyo only holding a 12.9% share of departure capacity, ahead of Chongqing's Jiangbei International Airport where Air China dominates with just a 13.5% capacity share. The 'Top 5' is completed by Manchester Airport in the UK and Los Angeles (LAX) International Airport in the USA, the largest of the featured airports, with Ryanair (14.7% share) and American Airlines (15.1%) holding the dominant share, respectively.
When the number of scheduled seats, the number of scheduled airlines and the percentage share of the dominant carrier are plotted on a graph in clearly illustrates some key trends and differences between the ten airports with the smallest dominant carrier share. Most of these are concentrated in one area on the graph, with the exception of the two North American airports. LAX is actually not in a bad space with a broad mix of carriers but with no one dominant operator, while New York's LaGuardia Airport, where Delta Air Lines dominates, has far less scheduled carriers than all the others.
CHART - Osaka, Tokyo, Chongqing, Manchester and Los Angeles are home to airports that have the smallest share of capacity held by their largest airline partner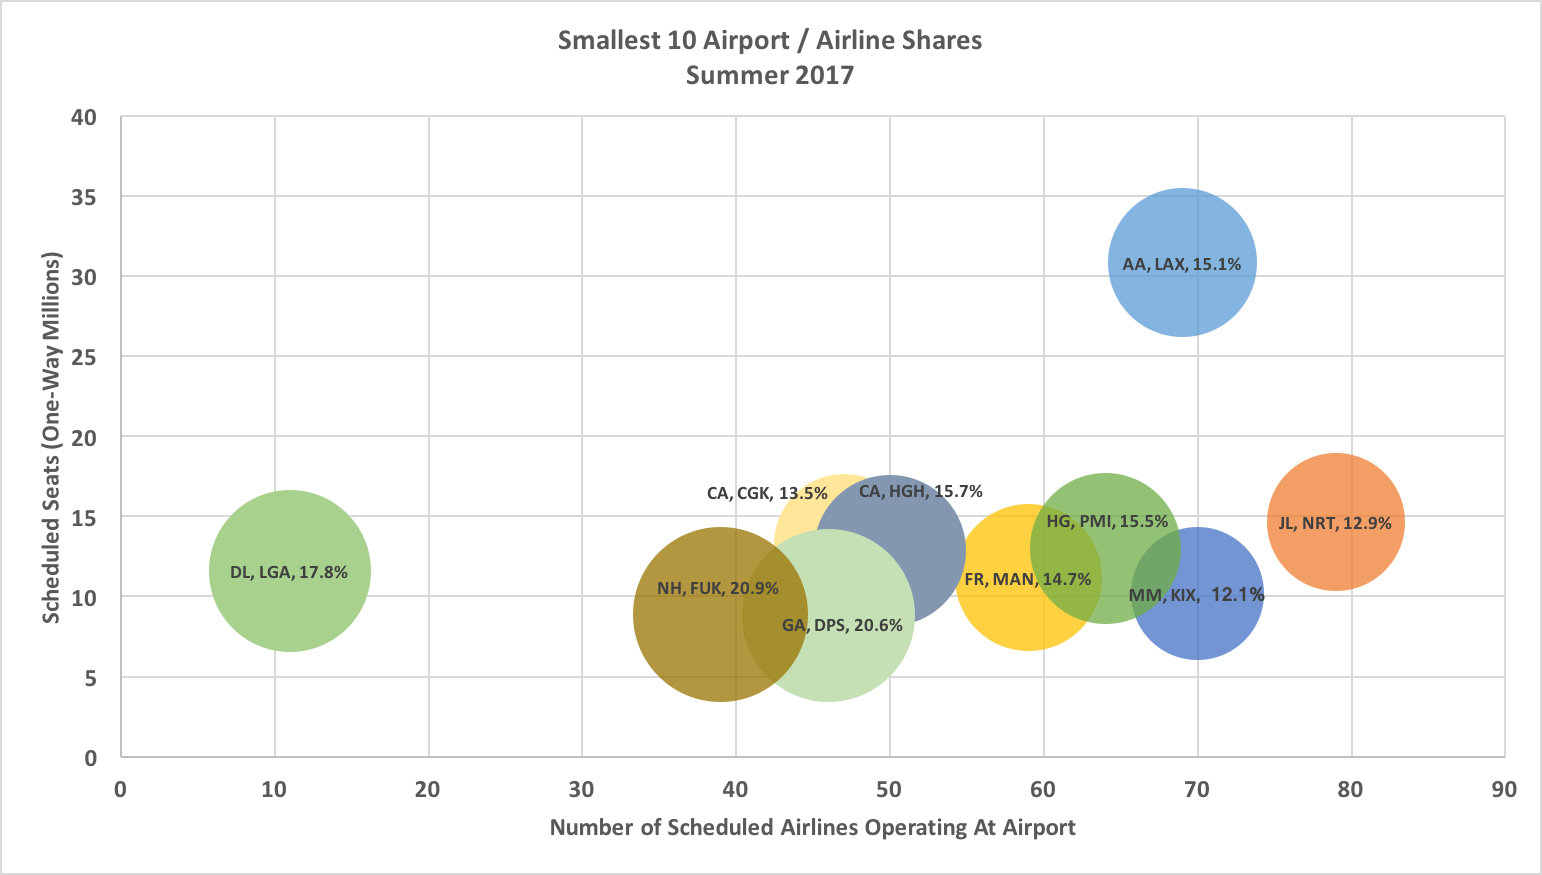 Source: The Blue Swan Daily, MIDAS Aviation and OAG
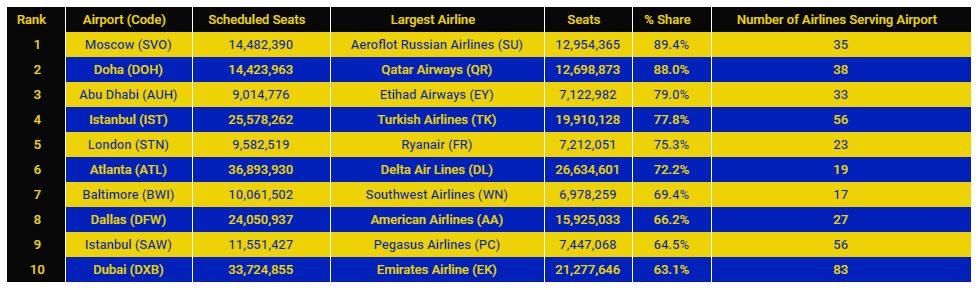
Moscow, Doha, Abu Dhabi, Istanbul and London home to airports that have the largest share of capacity held by their largest airliner partner
At the other end of the scale it is unsurprising to see some of the world's leading hub airports among those with the greatest share of capacity by the dominant carrier. However, there are some surprises among the 'Top 10' and not the most obvious airport top of the pile.
The big Gulf hubs of Abu Dhabi (Etihad Airways - 79.0%), Doha (Qatar Airways - 88.0%) and Dubai (Emirates Airline - 63.1%) are all among the list, as is Istanbul Ataturk (Turkish Airlines - 77.8%) and the US hubs of Hartsfield Jackson Atlanta International (Delta Air Lines - 72.2%) and Dallas/Fort Worth International (American Airlines - 66.2%). But it is Moscow Sheremetyevo that takes the crown as the world's airports with the largest dominant airline share, in its case Aeroflot Russian Airlines with a whopping 89.4% of departure seats this summer.
Among the 'surprise' entries in the 'Top 10' are Istanbul Sabiha Gokcen Airport (Pegasus Airlines - 64.5%), due to the split of operations by Turkey's two largest airlines between the city's two airports; Baltimore-Washington International (Southwest Airlines - 69.4%) and London's Stansted Airport (Ryanair - 75.3%). Interestingly, the latter's inclusion means the Manchester Airports Group's (M.A.G.) two largest airports are in the two lists, offering very different network philosophies.
CHART - Moscow, Doha, Abu Dhabi, Istanbul and London home to airports that have the largest share of capacity held by their largest airliner partner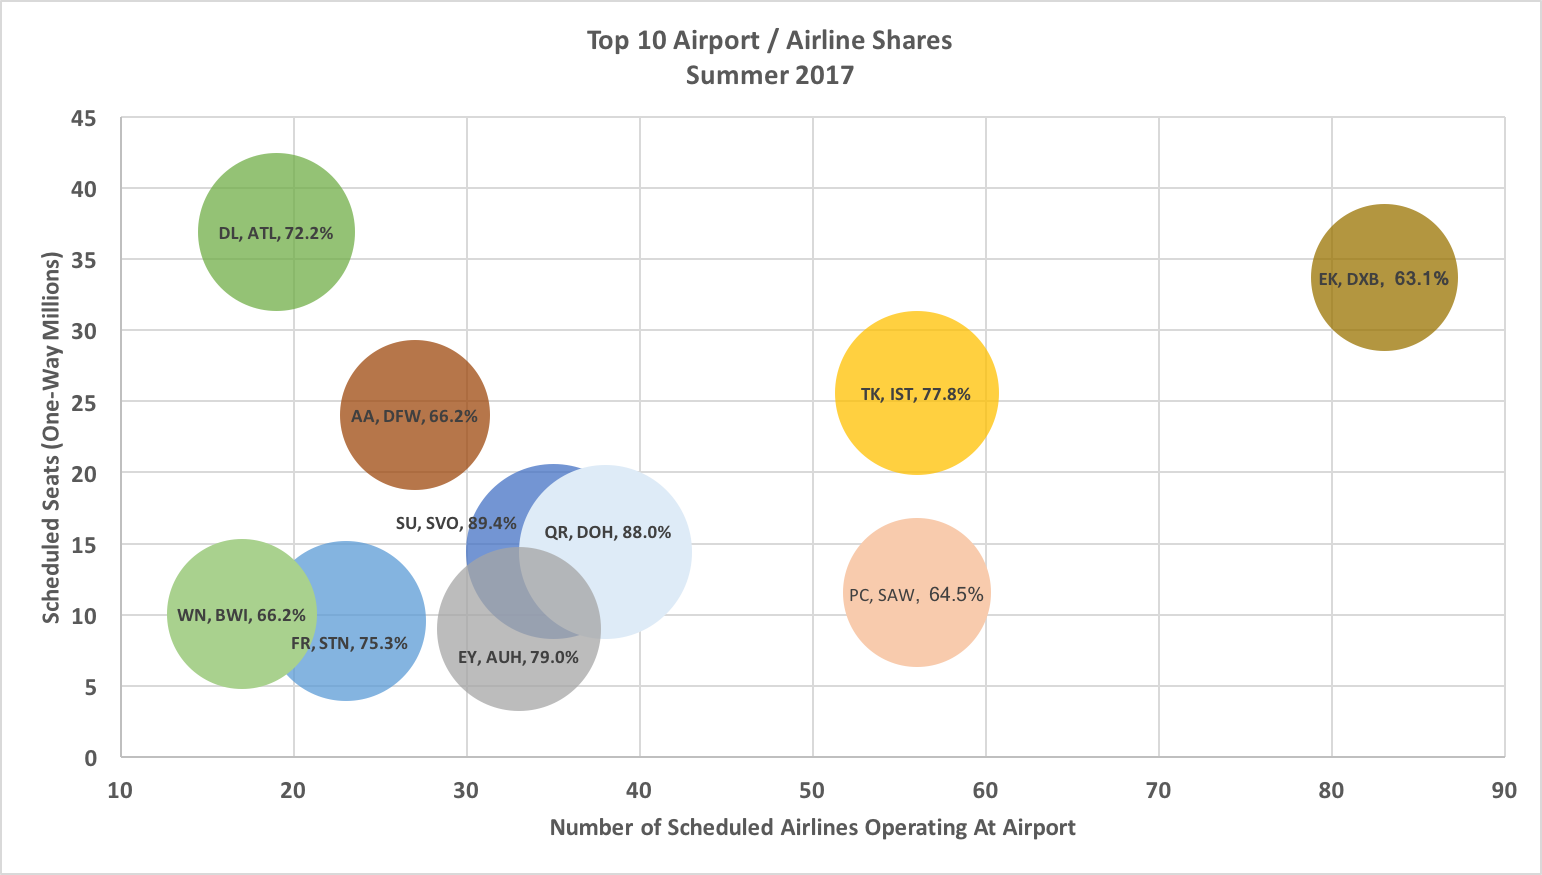
Source: The Blue Swan Daily, MIDAS Aviation and OAG
The analysis provides some insights that we just don't think about enough. For instance, it would seem that there are some very large scale airports in some markets where one airline has such a position of scale and share that other carriers almost consciously avoid that market. Which begs a question as to the value of those airports spending large amounts on route development activity with limited chance of a return.
Equally at the other end of the spectrum there is clearly a cluster of airports of reasonable scale that are "must have" parts of an airline network, principally leisure focussed and sun blessed. It is in the "contested" space of reasonable scale and customer base" of airports where effective positioning and successful destination marketing can be at their most effective.
** TOMORROW: In Part 2 we look more closely at airports across Asia and the South Pacific **