From a global perspective international air capacity literally fell off a cliff in March as the novel coronavirus leaped across the world. In its early days its impact was significantly under estimated. Ironically, our enhanced global connectivity delivered by air transport helped it spread, before it savagely wounded the same industry.
The fall was significant. During January global year-on-year capacity growth started to slide from +3.5% to +2%, falling into negative territory in February, before its freefall in March. The fall continued in April, before hitting the floor in May, with capacity levels down -72% year-on-year in the first week of the month.
We have seen airlines adding capacity, but demand hasn't necessarily followed. Global air capacity levels have seen a slow, steady but very shallow climb through May, June and July, peaking at the start of August just as they passed the -50% year-on-year figure. Is this as good as it gets as seasonal declines coincide with increasing rates of Covid-19 infections across many countries and the debilitating government action that quickly follows to minimise spread.
There is some confidence that international travel will commence its uptick as increasing measures are adopted to making air travel safer and corridors introduced between countries that are having success managing infection levels.
They say 'a picture paints a thousand words'. In this new regular section The Blue Swan Daily introduces a new graphical insight into a key industry observation or trend. In this first edition we highlight the country markets that have seen the smallest and largest percentage decline in international air capacity over the first eight months of the year.
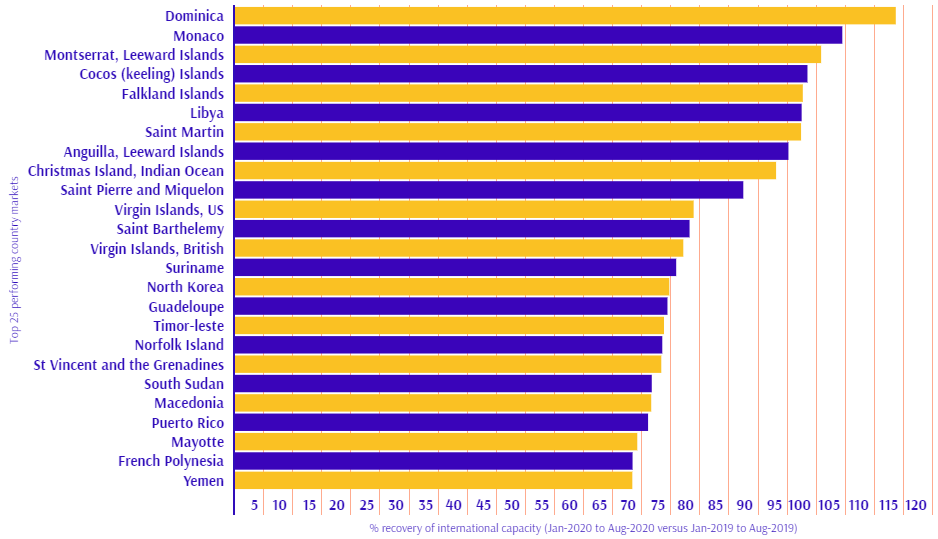
Here's the top 25 performers, those with the smallest declines in international air capacity over the first eight months of 2020, versus the same period last year, based on flight schedule data from OAG…
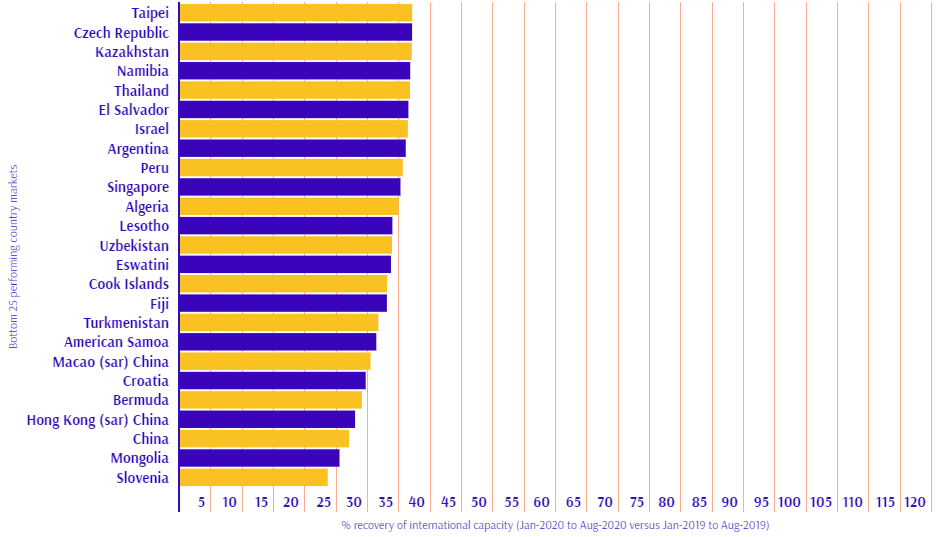
Here's the bottom 25 performers, those with the largest declines in international air capacity over the first eight months of 2020, versus the same period last year, based on flight schedule data from OAG…