Summary:
- Australia's airports have seen departure capacity increase +0.9% across the first eight months of 2018, versus the same period last year;
- While the largest airports in Sydney (+1.4%) and Melbourne (+2.6%) are growing, airports in Canberra (+7.9%) and Hobart (+9.1%) have seen the largest domestic growth;
- Australia's largest airports are taking an increasing share of domestic travel - its top ten have a 82.9% share of seats in first eight months of 2018 , up 0.2 percentage points on the same period in 2017;
- Official Tourism Research Australia data shows domestic tourism accounted for 97.3 million overnight visitors and 350.6 million overnight stays in the year ending Mar-2018.
Across the country as a whole, departing domestic seats have increased +0.9% year-on-year, with the top ten domestic airports accounting for 82.9% of the total capacity, up 0.2 percentage points on the same period in 2017. These airports sustain strong business and leisure traffic point-to-point demand while at the same time facilitating connecting flows both within Australia and across international markets.
Melbourne Tullamarine has delivered the most additional seats to the domestic market in the Jan-2018 to Aug-2018 timescale and almost double the level added at the larger Sydney Kingsford Smith. Other growing airports in the top ten were in Adelaide (+2.3%) and Gold Coast (+1.5%), but it was in the capital Canberra (+7.9%) and Hobart (+9.1%), the capital and most populous city of the island state of Tasmania, where the largest year-on-year growth has been recorded.
CHART - Hobart and Canberra have seen the largest rise in departing domestic seats in Australia over the first eight months of 2018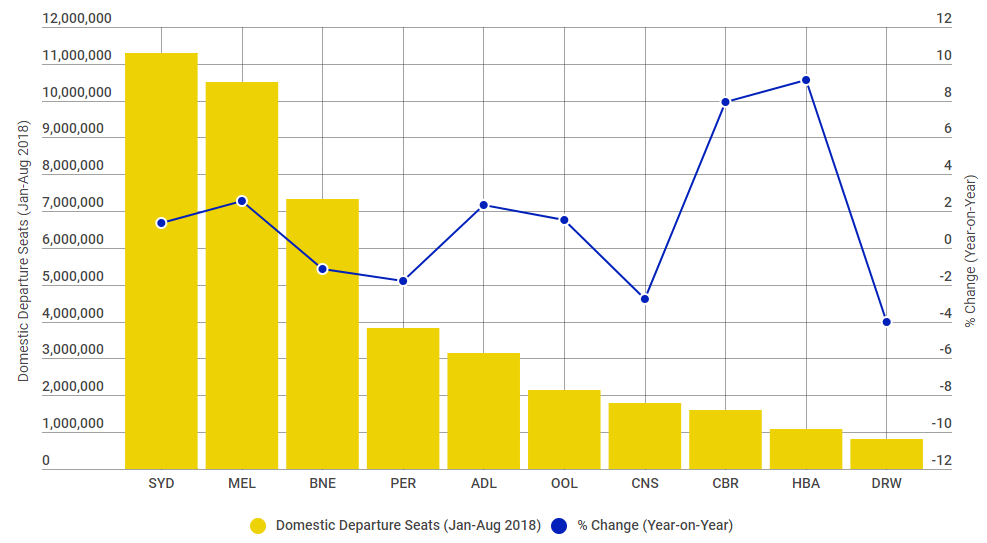 Source: The Blue Swan Daily and OAG
In what is a mature and relatively stable market capacity variations between the first eight months of 2017 and 2018 have generally shown only a small variance. None of the 50 largest domestic airports has witnessed double-digit capacity increases and you have to go down to Horn Island airport in Queensland (59th), Coondewanna airport in Western Australia (62nd) and Orange Regional airport in New South Wales (64th) to see such rates of growth, and these are from relatively low bases. It should be noted that Sunshine Coast in Queensland (ranked 14th largest) did come close recording a +9.3% year-on-year rise.
CHART - Sunshine Coast, Mackay, Horn Island and Melbourne Essendon are performing alongside the country's majors in terms of additional domestic departure seats added across the first eight months of 2018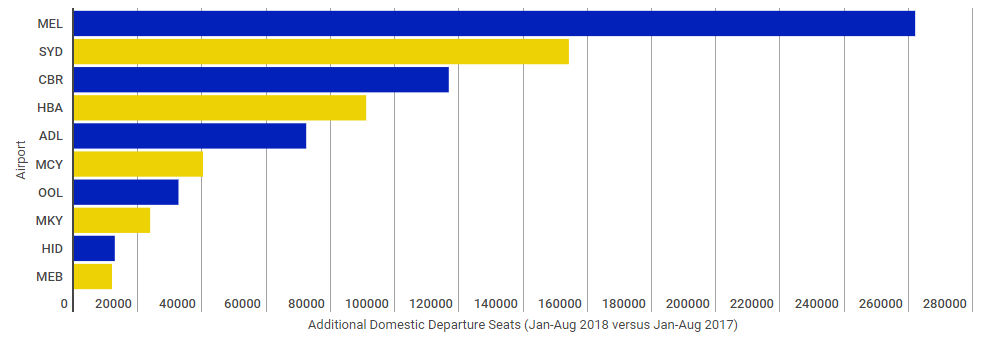 Source: The Blue Swan Daily and OAG
Official data from Tourism Research Australia, a branch of Austrade, the Australian Government's trade, investment and education promotion agency shows that domestic tourism accounted for 97.3 million overnight visitors in the year ending Mar-2018, up +6%, 350.6 million overnight stays, up +5% and AUD65.1 billion in overnight spend, up +5%.
Additionally, its data shows that domestic business travel increased +11% to 21.3 million and spend was up +6% to AUD16.3 billion during the period. Domestic day visitors increased +5% to 195.4 million and spend was up +6% to AUD20.8 billion, bringing total domestic (day and overnight) spend to AUD85.9 billion. Almost all state and territories experienced visitor growth, with NSW and Tasmania recording the highest growth at 10%, while there was a continued growth in nature-based activities including bushwalking (up +18% to 12.2 million) and visiting national or state parks (up +15% to 11.5 million).