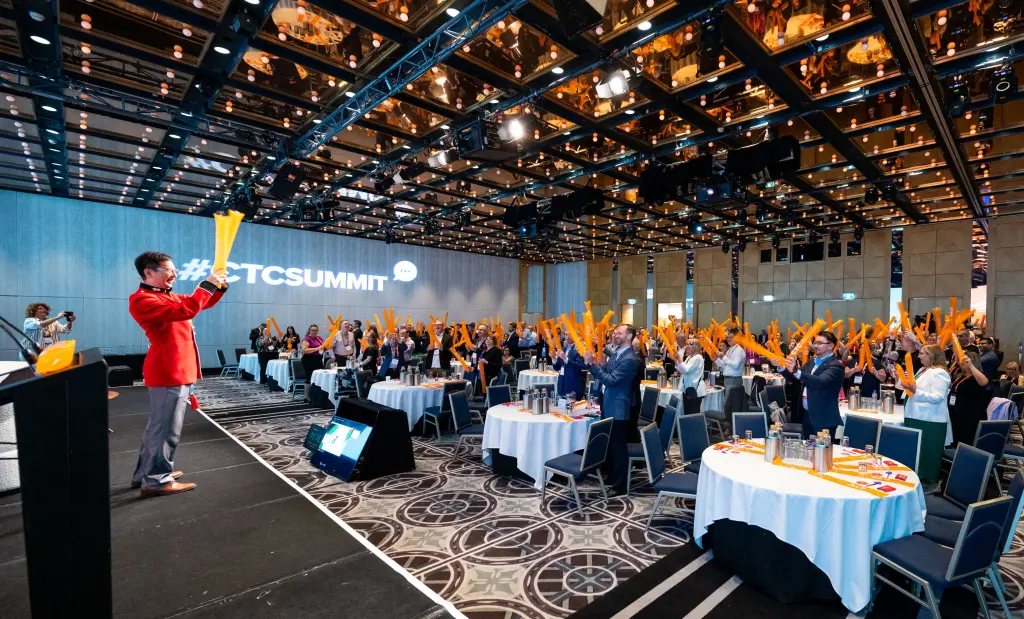
If you have been in Sydney the past couple of days we hope you had a rewarding time at CTC - Corporate Travel Community's Australasia Corporate Travel Summit & Awards.
If you haven't, here's what you have missed.
The richest 1% of the world's population produced as much carbon pollution in 2019 as the five billion people who made up the poorest two-thirds of humanity, according to a report published by Oxfam ahead of the UN Climate Summit, COP28.
The report, 'Climate Equality: A Planet for the 99%', is based on research with the Stockholm Environment Institute (SEI). It assesses the consumption emissions of different income groups, highlighting the stark gap between the carbon footprints of the super-rich -whose carbon-hungry lifestyles and investments in polluting industries like fossil fuels are driving global warming- and the rest of the world.
AMP, the Australian wealth management organisation, was recognised for the sustainability credentials of its corporate travel programme at CTC - Corporate Travel Community's Australasia Corporate Travel Summit & Awards in Sydney.
With a history spanning 174 years and more than 4,000 staff around the world, AMP is a financial services company in Australia and New Zealand providing superannuation and investment products, financial advice, and banking products including home loans and savings accounts. Its divisions include AMP Capital, among the top ten infrastructure managers globally and one of the largest real estate managers in Asia, AMP Financial Services and Axa Asia Pacific.
IHG Hotels & Resorts has announced the signing of its first Vignette Collection hotel in Qatar in partnership with Hospitality for Success H4S Hotels & Residences, one of Al Baladi Holding companies.
Set to open by the end of 1Q2024, Velero Hotel Vignette Collection Doha Lusail is IHG's fifth Vignette Collection hotel signing in the MEA region, following those in Zimbabwe, Saudi Arabia, UAE and Kuwait.
The rapid recovery of passenger traffic during 2022 also saw a spike in operational disruptions globally - leading to queues in airports, delays and cancellations for airlines and disgruntled travellers.
With the Asia Pacific undergoing a slower traffic recovery, these problems have not been as pronounced for much of the region.
However, with supply chains disrupted and labour markets upended, airlines have still struggled to get things right on the operational front.
As traffic continues to build and some markets push beyond pre-pandemic levels, the performance of the regional air travel sector remains under pressure.
Airlines and airports will need to work with the public sector providers to ensure that the system is robust and able to handle both peak volumes and interrupted and irregular operations.
New research from Corporate Traveller, the SME division of Flight Centre Travel Group, has found that Australian business travellers are increasing the length of domestic trips.
New data reveals growth in bleisure travel, driven by hybrid and flexible working arrangements and the need for work-life balance. Conversely, short trips saw negative growth this year.
Each week, CAPA - Centre for Aviation produces informative, thought provoking and detailed market analysis of the aviation industry. With supporting data included in every analysis, CAPA provides unrivalled and unparalleled intelligence.
Here's some of the reports published over the past week.
CTC - Corporate Travel Community each week brings you a roundup of the most thought-provoking and interesting comments from those industry leaders in the know.
With China's borders now re-opened to international travel, waves of outbound travel are expected to build in the market.
After almost three years of restricted travel, Chinese travellers are back but their demands and expectations are not the same as before the pandemic.
Chinese travellers have initially opted for 'safe' markets, including Hong Kong, Macau and select regional destinations.
COVID-19 has also accelerated the swing away from large, organised tour groups and towards individual and small group travel with freer itineraries.
This was the topic of a panel discussion at the CAPA Asia Aviation Summit in Kuala Lumpur Brisbane at the start of Nov-2023.
Weekly Newsletter
Click Subscribe if you'd like to receive the latest corporate travel news and analysis.


