The busiest international route in the world is between Kuala Lumpur (KUL) and Singapore (SIN) with over 30,000 flights in the course of a year, operated by eight carriers with an average of 82 flights per day. It is only a short just over an hour journey to cover the almost 300km that separate the two airports, both major hubs in the region. In fact, it is these hubs that dominate the ranking with a cluster of routes around Kuala Lumpur (KUL), Singapore (SIN) and also Bangkok (BKK) and Hong Kong (HKG).
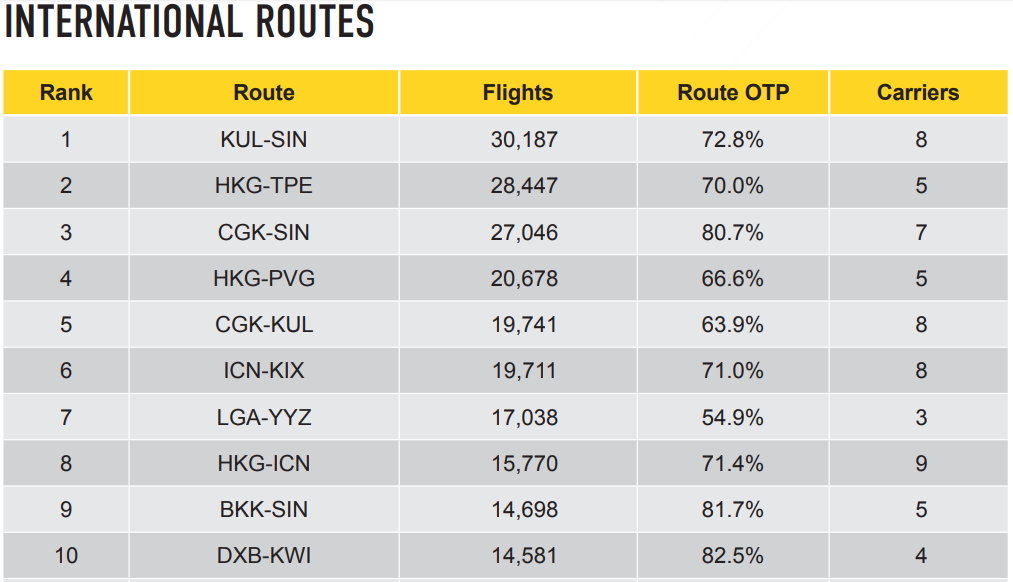
After Kuala Lumpur (KUL) - Singapore (SIN), Hong Kong (HKG) - Taipei (TPE), Jakarta (CGK) - Singapore (SIN), Hong Kong (HKG) - Shanghai (PVG) and Jakarta (CGK) - Kuala Lumpur (KUL) complete the top five list. The intra-Asian market is actually responsible for eight of the ten largest international routes by flight frequency, with New York (LGA) - Toronto (YYZ) in seventh and Dubai (DXB) - Kuwait (KWI) in tenth, the only out of region entries.
As well as being high frequency, the OAG analysis shows what sets some of Asia Pacific's routes apart are the number of carriers operating them - on average seven carriers - compared to just three in other regions. Similarly, many of Asia's busiest routes are characterised by a high volume of seats, with Hong Kong (HKG) - Taipei (TPE) identified as a striking example.
Here, over three quarters of the aircraft operating on the second busiest international route in the world are widebody aircraft, further reflecting the huge demand for air travel in this part of the world. Bangkok (BKK) - Hong Kong (HKG) is another route among the top ten that is dominated by widebodied equipment.
CHART - Routes across the Asia Pacific region are served by more carriers with larger aircraft than any other part of the world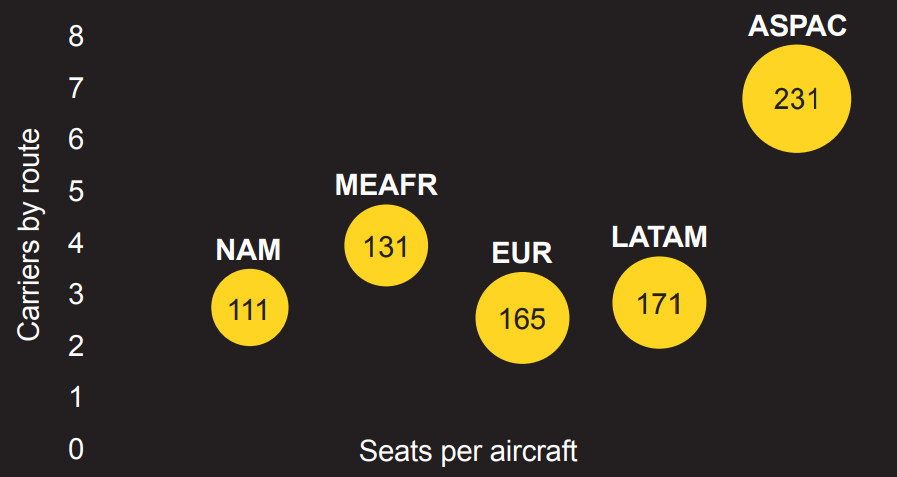 Source: OAG Busiest Routes report
Domestic routes are big business, with 15 globally having more flights operating each year than any international routes anywhere. The busiest domestic route globally is between Jeju (CJU) and Seoul (GMP) in South Korea. With nearly 80,000 annual flights, this route sees over 200 daily services operated by seven carriers.
It is a long way ahead of any other domestic market. In second is Sydney (SYD) - Melbourne (MEL) in Australia with 54,102 annual flights, third is Mumbai (BOM) - Delhi (DEL) in India with 45,188 annual frequencies, ahead of Sao Paulo (CGH) - Rio de Janeiro (SDU) in Brazil and Fukuoka (FUK) - Tokyo (HND) in Japan in fourth and fifth with just under 40,000 flights, respectively.
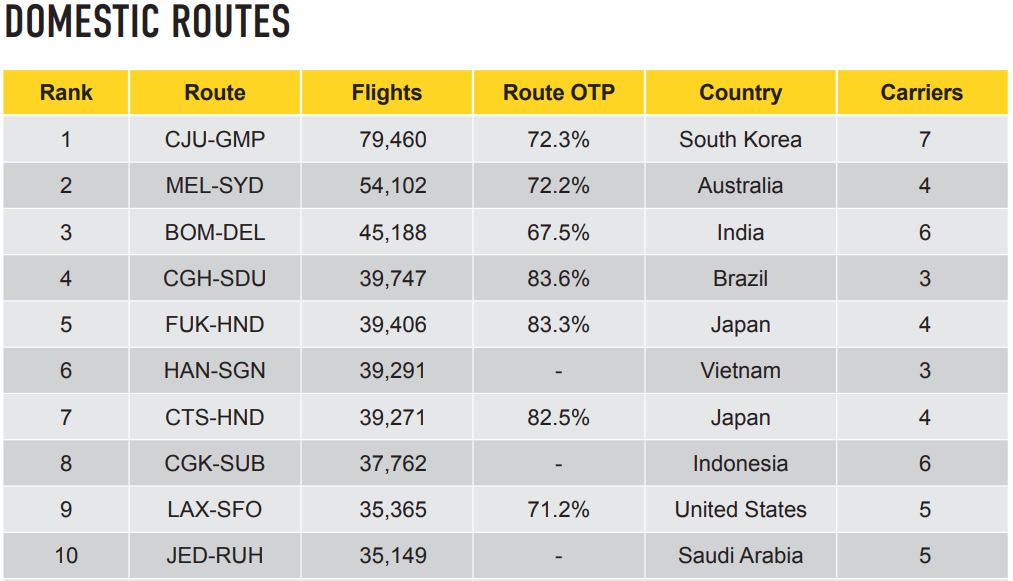
The top 20 busiest domestic routes are located in 13 different countries in every continent except Europe. Indonesia is home to more of them than any other country, with three. Each of Australia, China, India, Japan and the United States have two of the busiest domestic routes.
As would be expected, domestic routes on average have a higher share operated by narrowbody aircraft - 77% versus international routes which have 55% of flights on narrowbody aircraft. The Hanoi (HAN)-Ho Chi Minh (SGN) and Sapporo (CTS) -Tokyo (HND) have higher than average rates of widebody aircraft operating the route, reflecting the demand on these busy international routes.
Alongside looking at the biggest routes globally, the OAG report breaks its analysis down by region and also looks at the on-time performance (OTP) of the world's highest density trunk routes. Other notable observations from the analysis include:
- eight of the busiest long-haul routes operate within the US;
- Honolulu (HNL)-Tokyo (NRT) has the highest OTP of the busiest long-haul routes with just under 90% of flights operating on time;
- Air Canada is the largest operator of capacity on six of the top 10 international routes in North America;
- four of the top 10 busiest international routes in Europe originate or depart from London (LHR);
- the top 10 Latin American busiest route with the highest OTP is Panama (PTY) - San José (SJO) with 91% of flights on time;
- five of the top 10 busiest international routes in the Middle East and Africa are between Dubai (DXB) and other major regional cities in the Middle East. None of these routes are more than 900km.
While this analysis highlights the top markets in 2019, it doesn't compare them with last year, an insight that also tells a very enlightening story about industry trends as some routes drop out of the ranking. One example is Madrid (MAD) to Barcelona (BCN) in Spain, which has fallen victim to the success of the high-speed rail link between the two cities. This is a development that might manifest itself elsewhere in the world.
It is also interesting to note that there is no great correlation between city size and busiest air routes, which are driven by ethnic, commercial and leisure factors in a mix which varies widely.