OAG data highlighted recently that between Jan-2020 and Nov-2020 the total number of operational routes had reduced by almost a third from approaching 48,000 to around 33,500 with many of them still operational being operated at significantly reduced levels than previously, both from frequency and capacity related parameters.
The aviation sector has been among the top affected industries by the pandemic. It had supported 65.5 million global jobs - more than half of them indirectly through tourism - and had a global economic impact of USD2.7 trillion, according to the 2019 Aviation Benefits Report, a study by industry groups including the United Nations agency the International Civil Aviation Organization (ICAO).
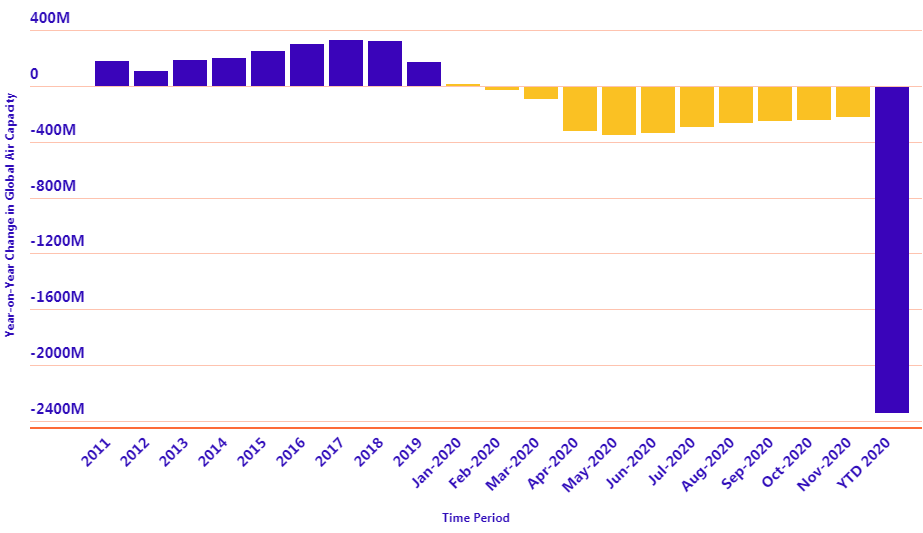
They say 'a picture paints a thousand words'. In this new regular section CTC - Corporate Travel Community offers a graphical insight into a key industry observation or trend. In this latest edition we use OAG schedule data to add our own number into the equation as we look at lost airline capacity through 2020, a staggering 2.3 billion seats across the first eleven months of the year and a figure that could reach 2.5 billion for the full year.