The scale of the loss is unprecedented and compares with just a -4% decline recorded during the 2009 global economic crisis as widespread travel restrictions to control the spread of the coronavirus pandemic subdued demand. The latest UNWTO World Tourism Barometer puts the cost of the collapse in international travel at USD 1.3 trillion in export revenues - more than 11 times the loss recorded during the 2009 global economic crisis.
Things may not feel any different right now as the evolving nature of the pandemic means many countries have been reintroducing stricter travel restrictions, but the gradual rollout of multiple COVID-19 vaccines is expected to help restore consumer confidence, reduce these restrictions and allow the easing of travel restrictions as we pass through 2021.
The latest UNWTO's Panel of Experts survey shows a mixed outlook for 2021. Almost half of respondents (45%) envisaged better prospects for 2021 compared to last year, while 25% expect a similar performance and 30% foresee a worsening of results in 2021. The overall prospects of a rebound in 2021 seem to have worsened too with half respondents (50%) now expecting a rebound to occur only in 2022 as compared to one in five (21%) in Oct-2020.
Positively, the remaining half of respondents still see a potential rebound in 2021, though below the expectations shown in the Oct-2020 survey (79% expected recovery in 2021). Looking further ahead, most experts do not to see a return to pre-pandemic levels happening before 2023. In fact, 43% of respondents point to 2023, while 41% expect a return to 2019 levels will only happen in 2024 or later.
Asia and the Pacific (-84%) - the first region to suffer the impact of the pandemic and the one with the highest level of travel restrictions still in place - recorded the largest decrease in arrivals in 2020 (300 million fewer), according to UNWTO data.
The Middle East and Africa both recorded a -75% decline; Europe recorded a -70% decrease in arrivals, despite a small and short-lived revival in the summer of 2020 and The region suffered the largest drop in absolute terms, with over 500 million fewer international tourists in 2020. The Americas saw a -69% decrease in international arrivals, following somewhat better results in the last quarter of the year.
They say 'a picture paints a thousand words'. In this regular section CTC - Corporate Travel Community offers a graphical insight into a key industry observation or trend. In this latest edition we use OAG schedule data to look more closely at regional capacity trends through 2020 and into 2021, highlighting that while all regions of the world have suffered some have been - and continue to be - hit harder than others.
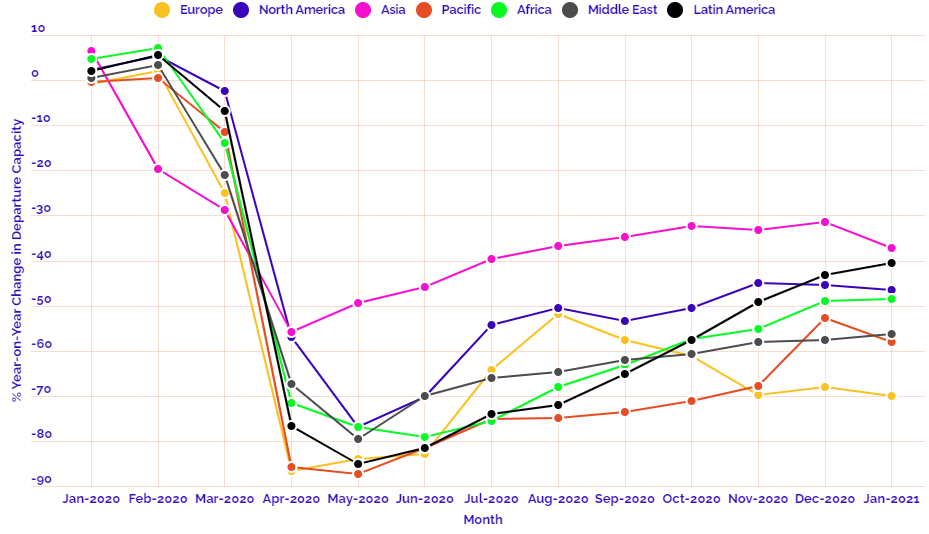
This regular section also now incorporates and expands on the charts produced in the 2020 air capacity series 'Coronavirus Statistics Snapshot'. These include a weekly look at how the pandemic is impacting global flight levels in the world's largest markets; a week-on-week and year-on-year comparison of flight departures by geographical region and a look at how weekly capacity is trending: the latter comparing levels to 2020 and also to the 2019 baseline performance.
HEADLINE FIGURES FOR WEEK COMMENCING 01-Feb-2021:
Departure frequencies down -0.50% versus last week; down -47.29% versus 2020 and down -48.81% versus 2019.
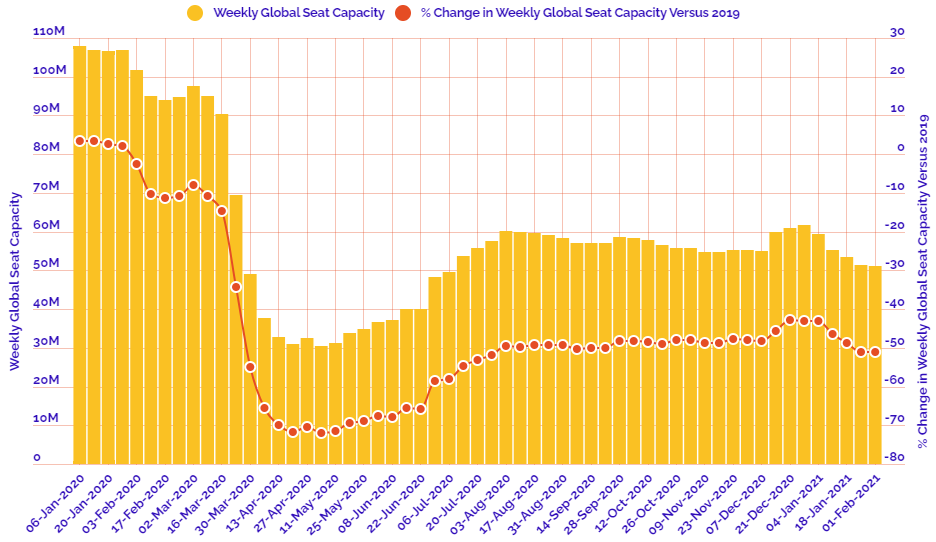
Seat capacity down -0.59% versus last week; down -49.88% versus 2020 and down -51.18% versus 2019.
CHART: Week-on-week change in flight departures by region
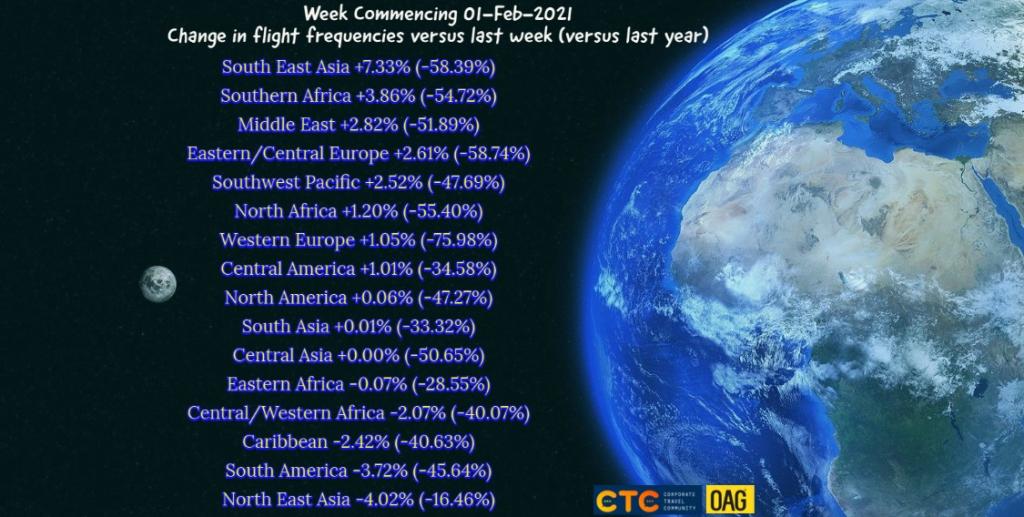
CHART: Year-on-year weekly departure performance for world's top 30 markets versus 2019
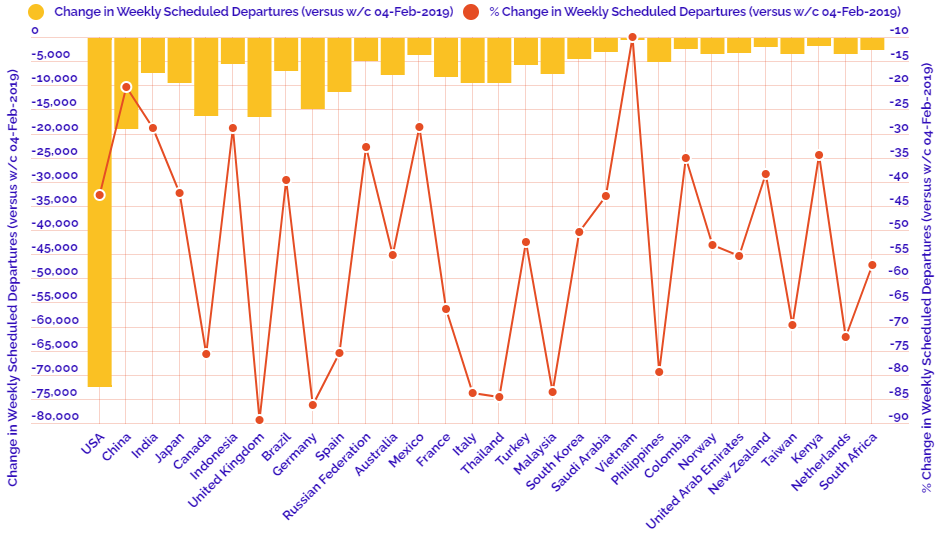
CHART: Year-on-year weekly departure performance for world's top 30 markets versus 2020
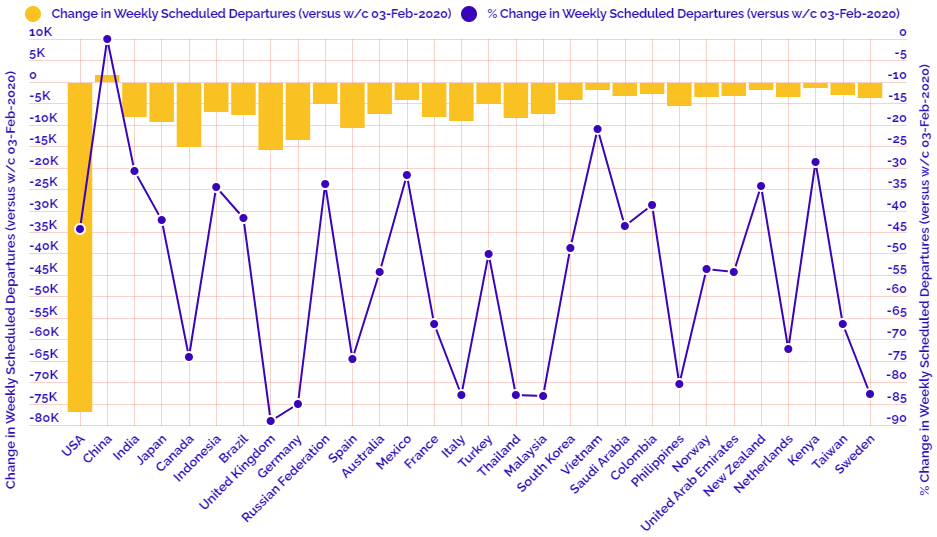
CHART: Departure capacity trends with year-on-year performance
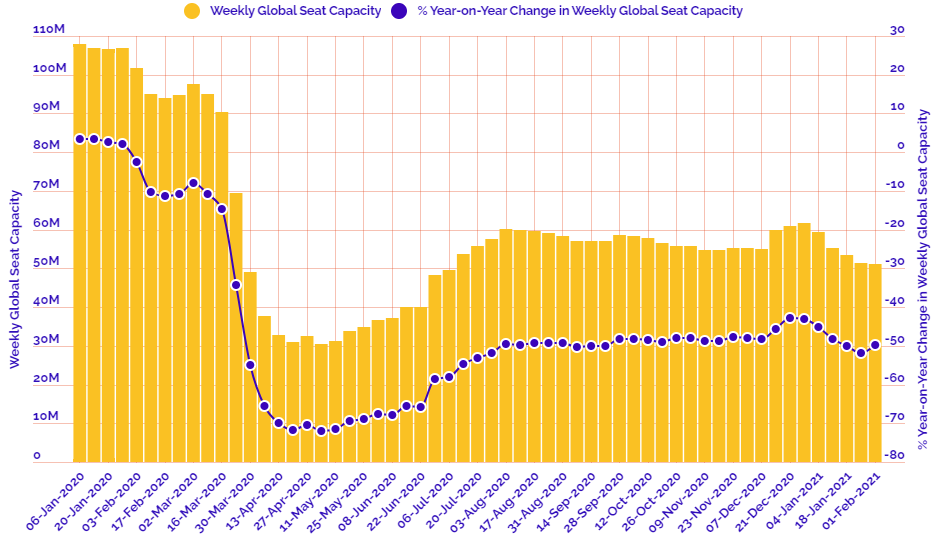
CHART: Departure capacity trends versus 2019