Normally the fifth busiest airport in Australia, the key gateway to South Australia has seen passenger and traffic levels fall beyond -90% over the past few months, a far cry from the more than eight million domestic and international passengers in normally handles on an annual basis, including important links into the Asia Pacific and Middle East.
Passenger numbers had more than doubled since the airport was privatised in 1998, while international passenger numbers more than quadrupling over the same period to more than one million. Now they have fallen to just a trickle as Australia maintains restrictions on international travel.
For its 2019/2020 financial year, parent Adelaide Airport Limited saw overall passenger traffic decline by -24.1%, due to the impact of Covid-19 on travel during the second half of the year, highlighted in fourth quarter performance where there was an overall decline of -95.6% in passenger traffic as a result of continued travel restrictions, both domestically and internationally, which significantly impacted the quarter's performance.
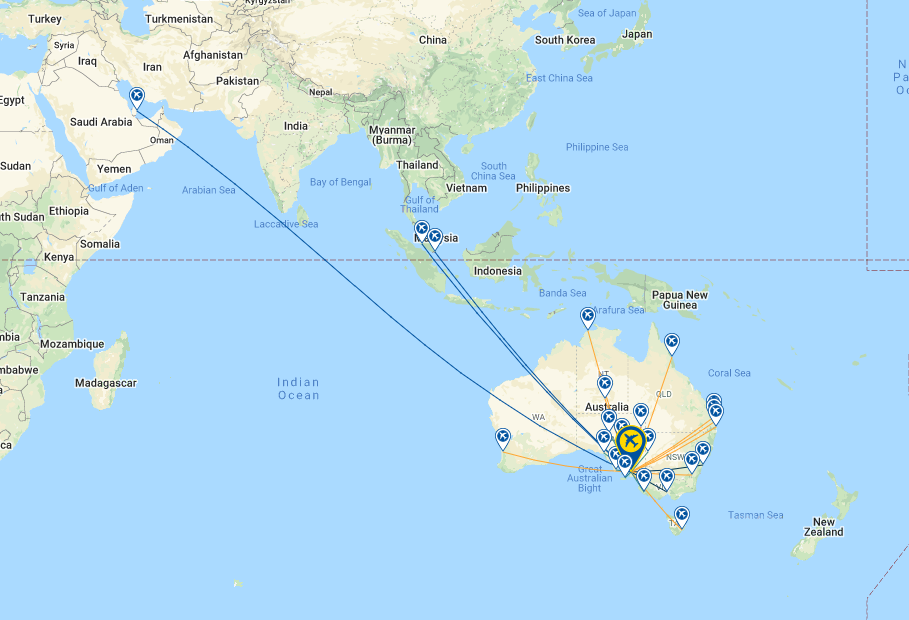
NETWORK MAP (as at 31-Aug-2020)

GLOBAL RANKING (as at 31-Aug-2020)

DESTINATIONS (as at 31-Aug-2020)
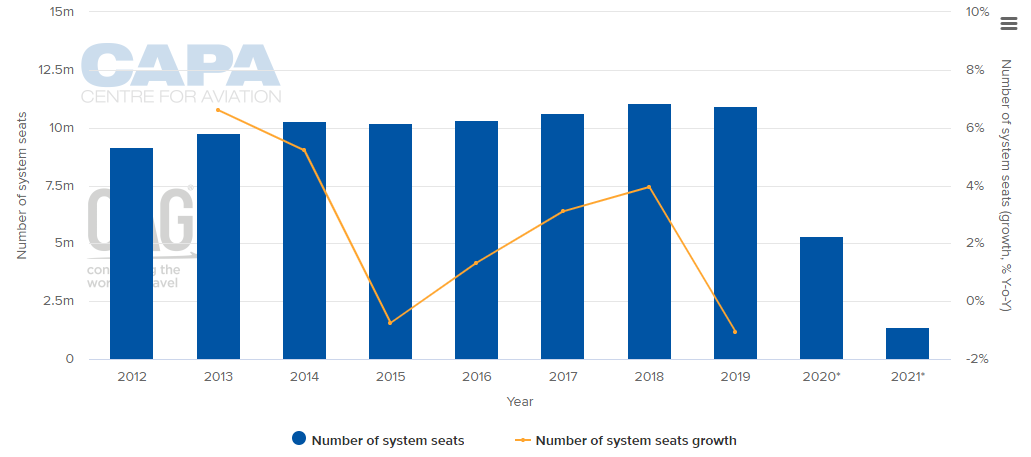
ANNUAL CAPACITY (2012-2020*)NOTE:The values for this year are at least partly predictive up to 6 months and may be subject to change
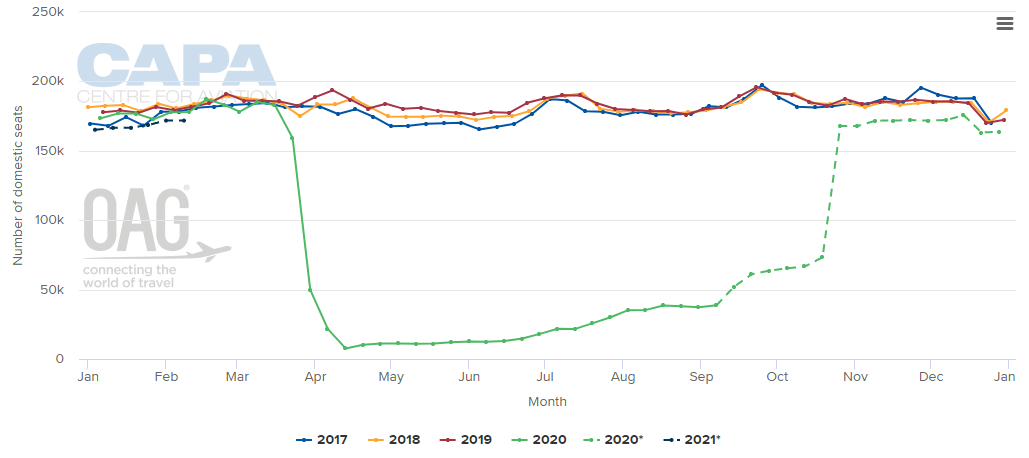
WEEKLY DOMESTIC CAPACITY (2017 - 2020*)NOTE:*the values for this year are at least partly predictive up to six months and may be subject to change.
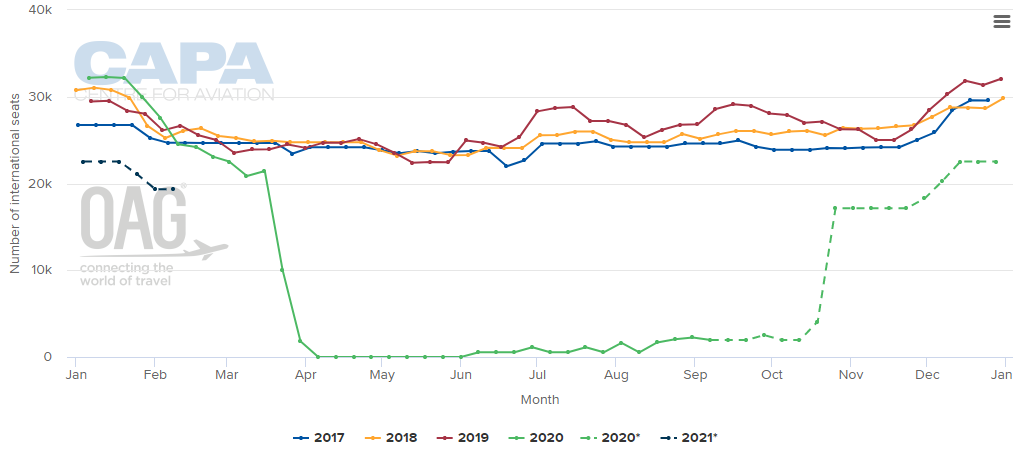
WEEKLY INTERNATIONAL CAPACITY (2017-2020*)NOTE:*the values for this year are at least partly predictive up to six months and may be subject to change.
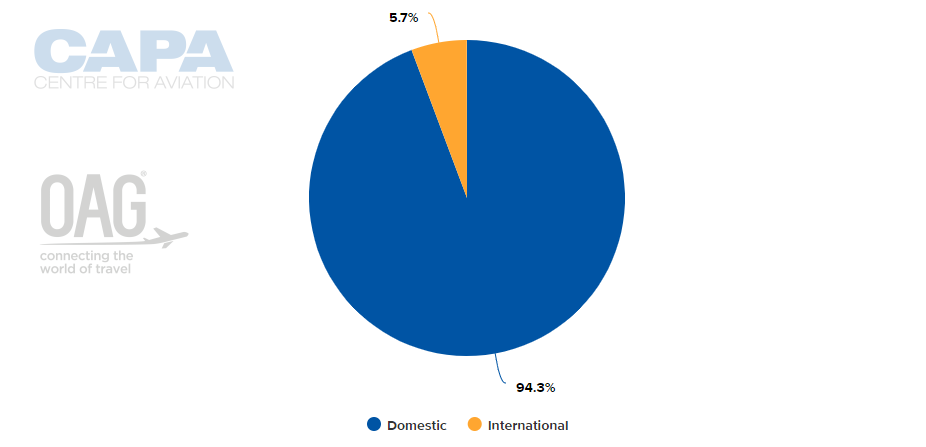
CAPACITY SPLIT BETWEEN DOMESTIC AND INTERNATIONAL OPERATIONS (w/c 31-Aug-2020)
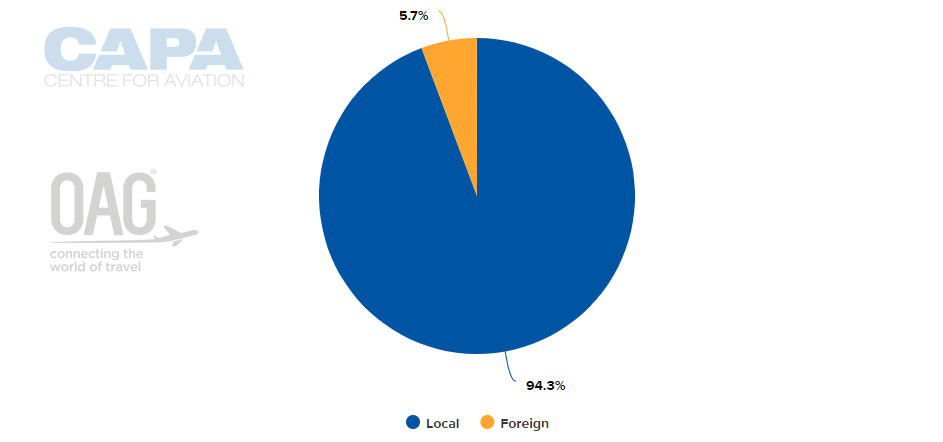
CAPACITY SPLIT BETWEEN LOCAL AND FOREIGN OPERATORS (w/c 31-Aug-2020)
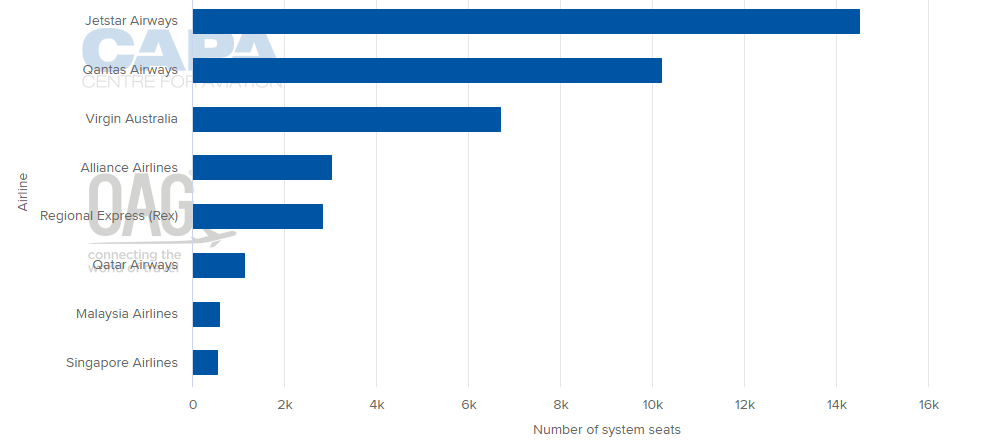
LARGEST AIRLINES BY CAPACITY (w/c 31-Aug-2020)
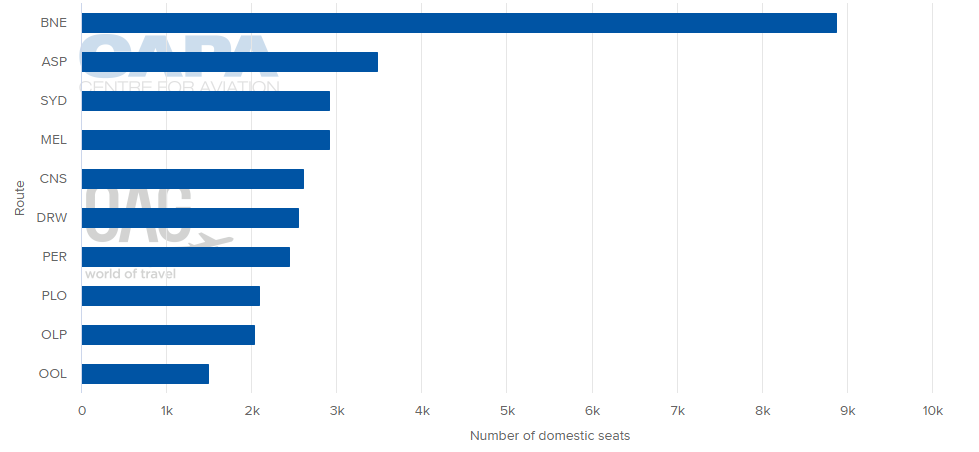
LARGEST DOMESTIC DESTINATION MARKETS (w/c 31-Aug-2020)
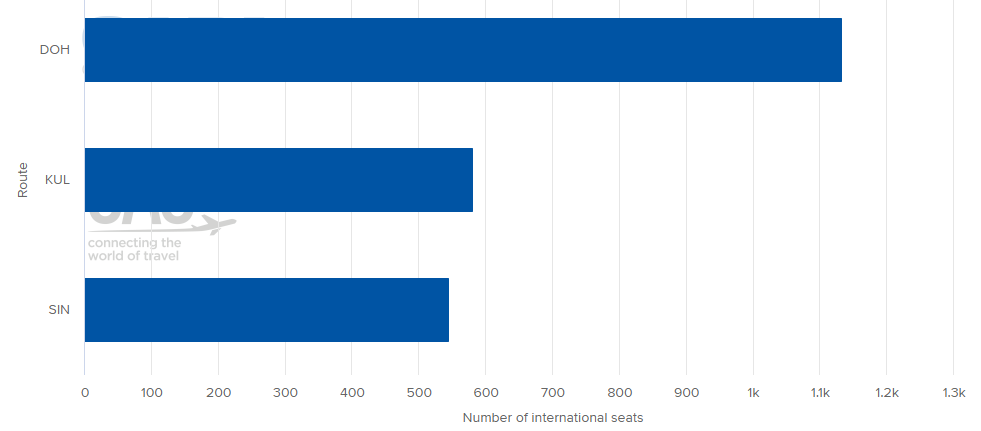
LARGEST INTERNATIONAL DESTINATION MARKETS (w/c 31-Aug-2020)
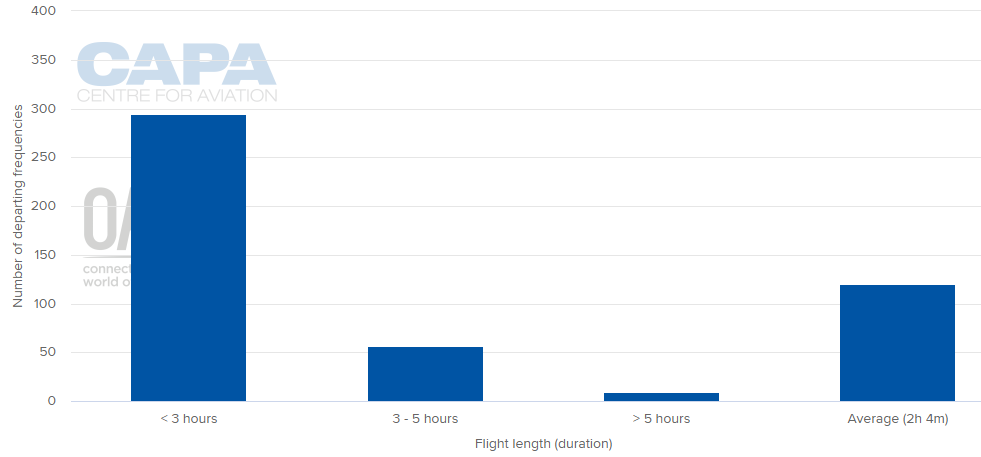
AVERAGE FLIGHT LENGTH (w/c 31-Aug-2020)
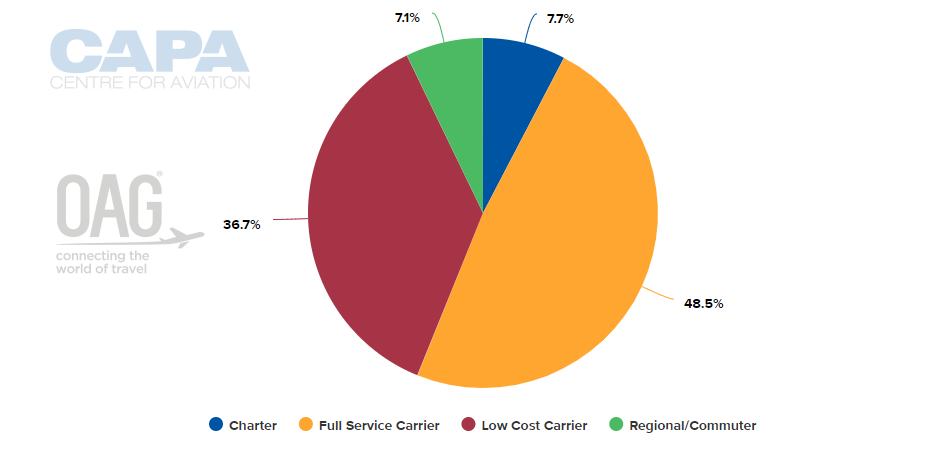
AIRLINE BUSINESS MODEL CAPACITY SPLIT (w/c 31-Aug-2020)
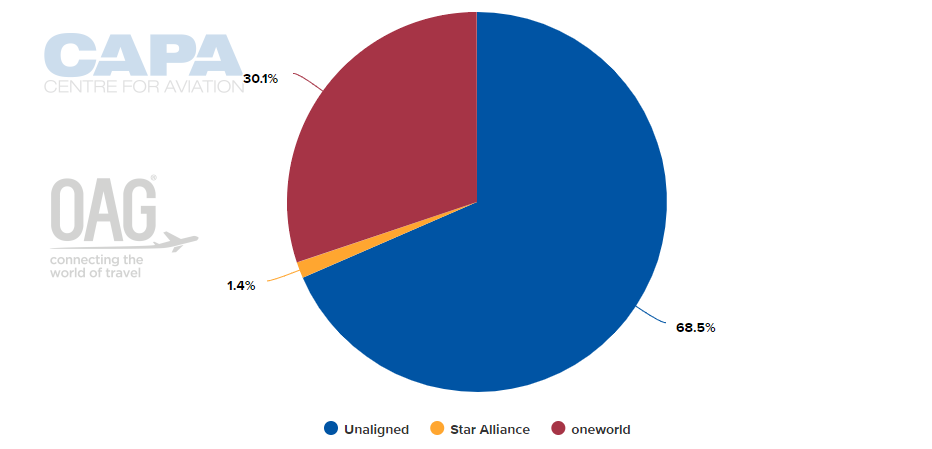
ALLIANCE CAPACITY SPLIT (w/c 31-Aug-2020)
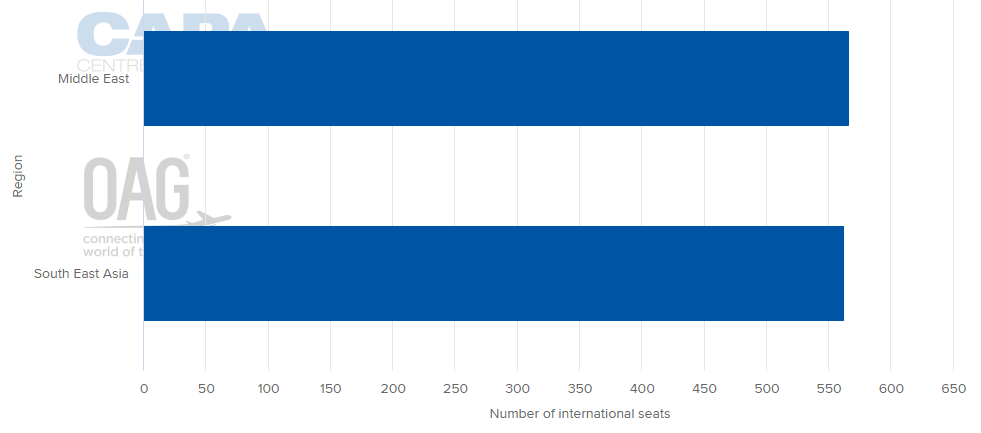
INTERNATIONAL MARKET CAPACITY BREAKDOWN BY REGION (w/c 31-Aug-2020)
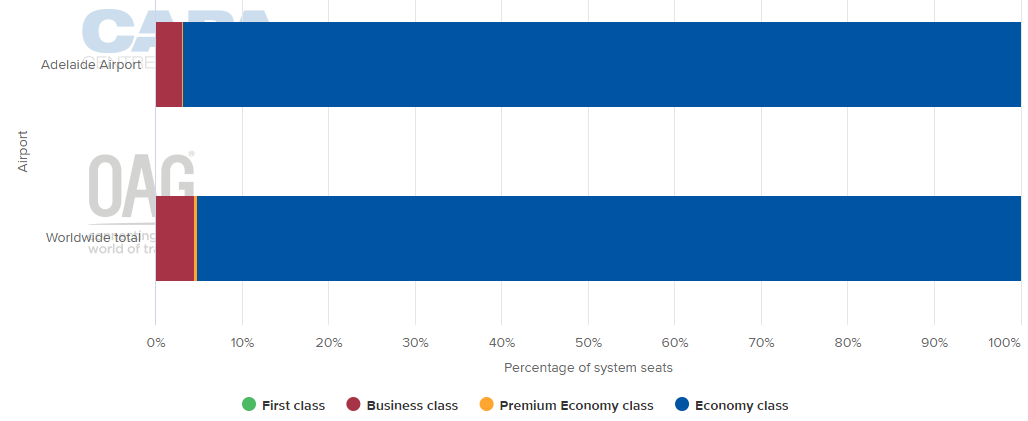
DEPARTING SYSTEM SEATS BY CLASS (w/c 31-Aug-2020)
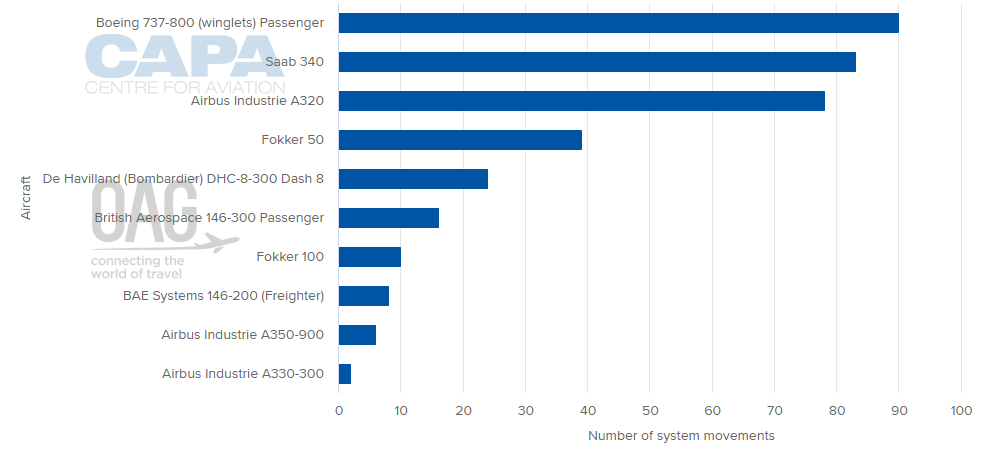
AIRCRAFT OPERATIONS BY MOVEMENTS (w/c 31-Aug-2020)
MORE INSIGHTS...
CAPA: 74% recovery in domestic Australia capacity by end-2020 - UPDATE
Asia-Pacific countries lay groundwork for cross-border travel
COVID-19: Virgin Australia to survive, but in what form - and name?
COVID-19: Forward indicators for Australia aviation & travel