A couple of Lufthansa Boeing 747s sat on the apron is a rare sight at any airport outside of Germany. But that was the case at Christchurch International Airport during the early stages of New Zealand's Covid-19 lockdown as the aircraft repatriated Germany citizens out of the country.
While such a site may not be seen again, the main gateway to South Island is already seeing an upturn in domestic operations as New Zealand becomes one of the leaders in the post Covid-19 recovery and widely held among the nations to have best responded and controlled the spread of the pandemic. The next step will be to rebuild international connectivity as other nations match its own actions.
Less than two months after unrestricted domestic air travel was permitted in New Zealand under Alert Level Two, strong demand through the school holiday period saw 10,700 passengers pass through Christchurch Airport on the first day of this week. Remarkably, that represents a recovery within 10% of volumes recorded on the same day last year.
The airport is operating at "about 45% of normal" according to its CEO Malcolm Johns and will be "back to 55%" by Aug-2020. "That's a lot quicker than we anticipated, to be honest," he acknowledges, but warns that a cautious outlook remains. "There's no question this is a risky time for aviation and tourism," he says. "The next six to eight months" of negotiations between airlines and airports "are going to be incredibly influential about how the following decade of aviation in this part of the world plays out," according to the executive.
NETWORK MAP (as at 06-Jul-2020)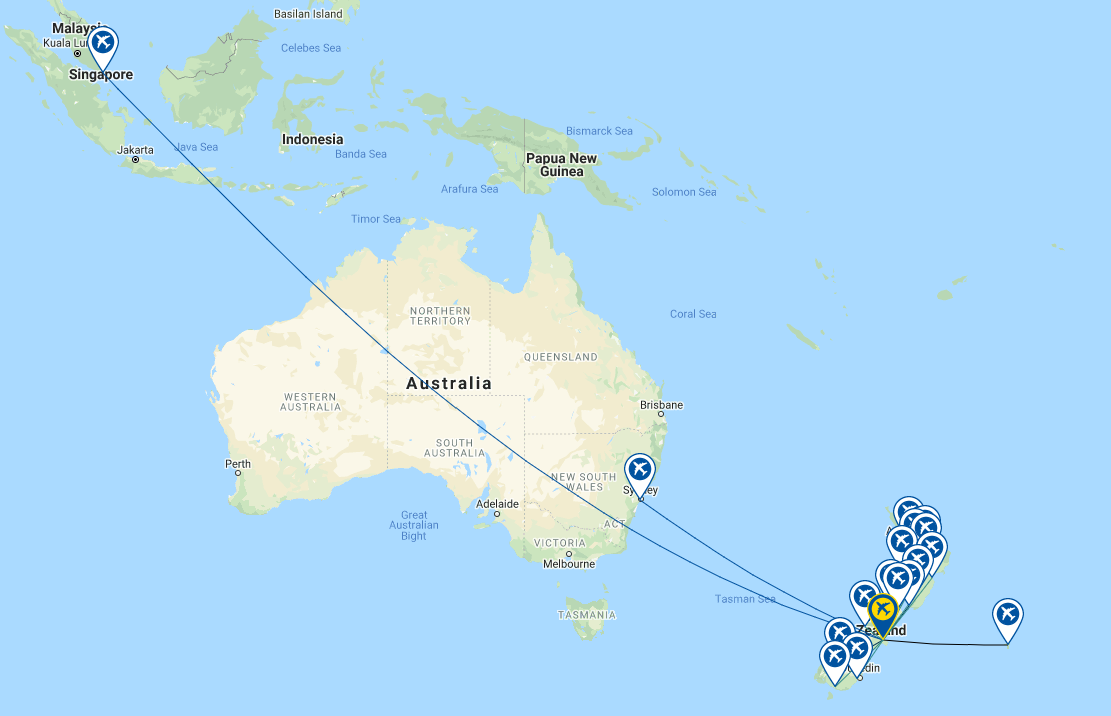
GLOBAL RANKING (as at 06-Jul-2020)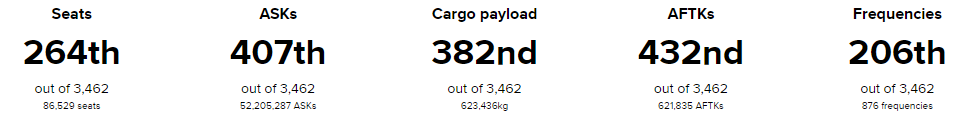
DESTINATIONS (as at 06-Jul-2020)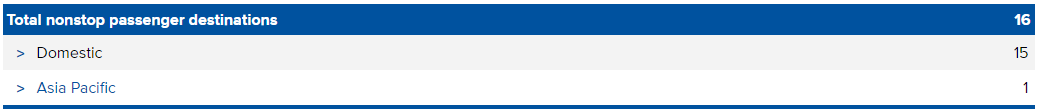
ANNUAL CAPACITY (2012-2020*)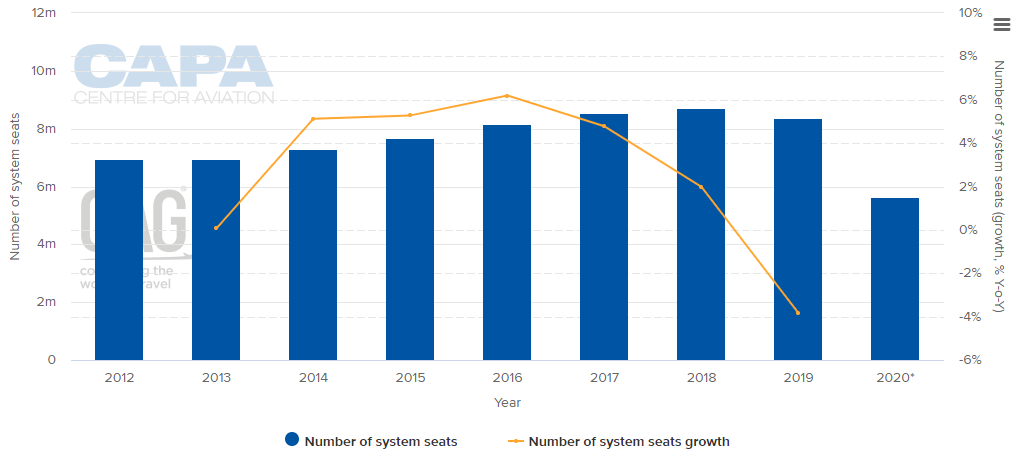 (NOTE:The values for this year are at least partly predictive up to 6 months and may be subject to change)
WEEKLY DOMESTIC CAPACITY (2017 - 2020*)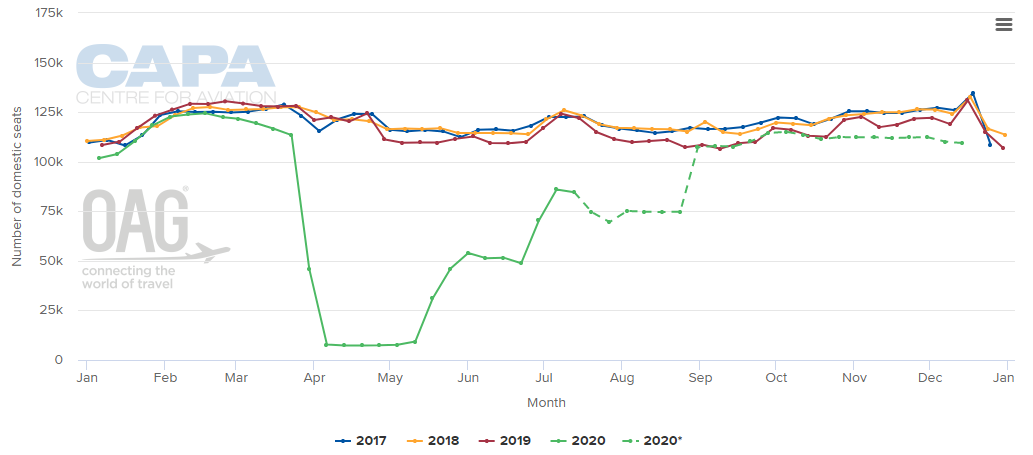 NOTE:*the values for this year are at least partly predictive up to six months and may be subject to change.
WEEKLY INTERNATIONAL CAPACITY (2017-2020*)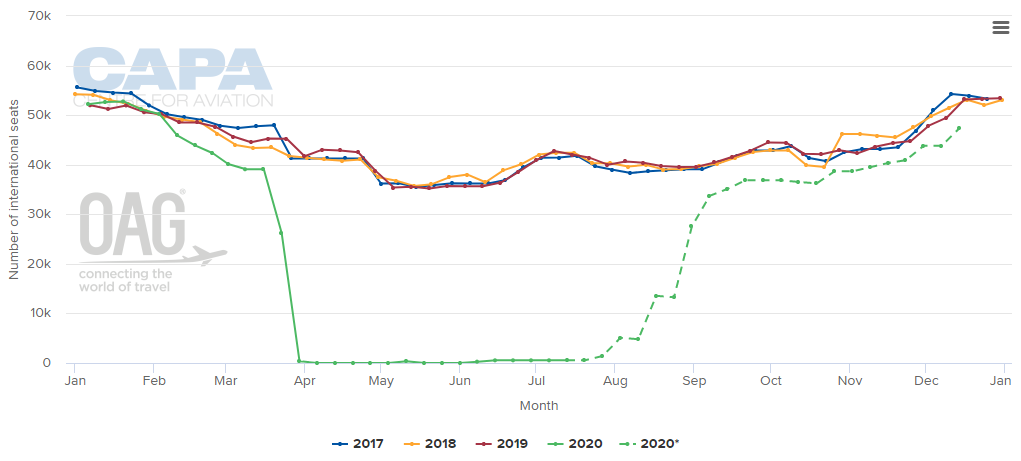 NOTE:*the values for this year are at least partly predictive up to six months and may be subject to change.
CAPACITY SPLIT BETWEEN DOMESTIC AND INTERNATIONAL OPERATIONS (w/c 06-Jul-2020)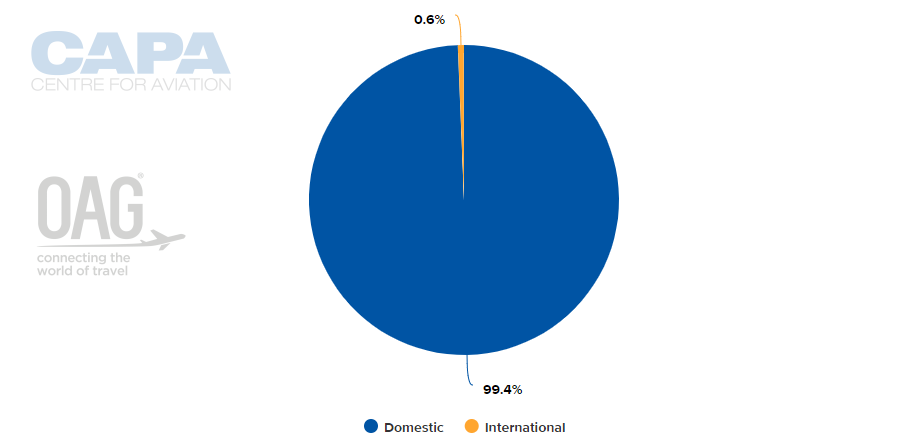
CAPACITY SPLIT BETWEEN LOCAL AND FOREIGN OPERATORS (w/c 06-Jul-2020)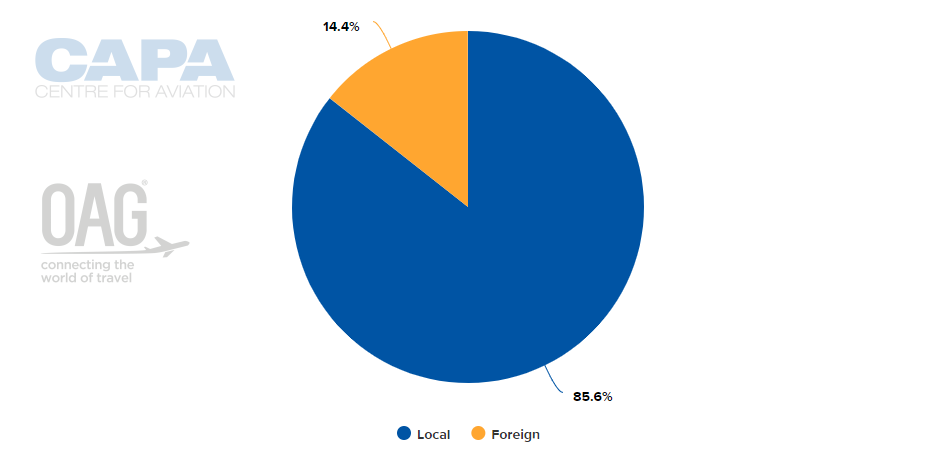
LARGEST AIRLINES BY CAPACITY (w/c 06-Jul-2020)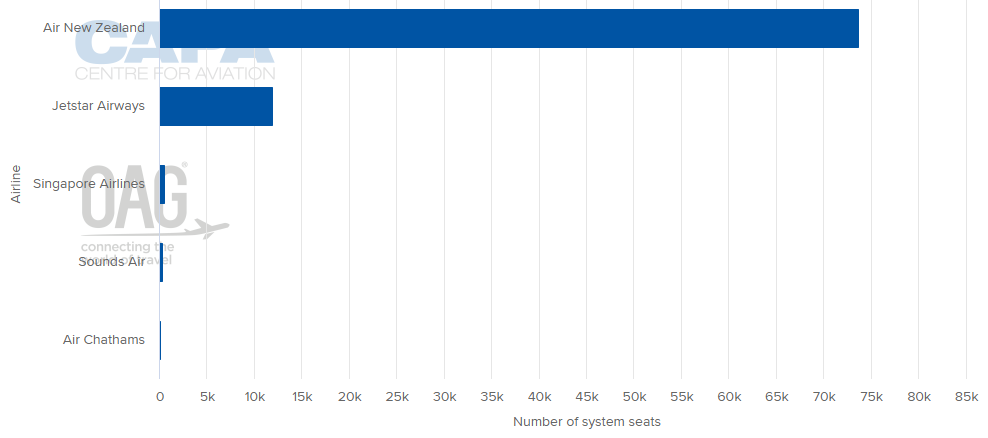
LARGEST DOMESTIC DESTINATION MARKETS (w/c 06-Jul-2020)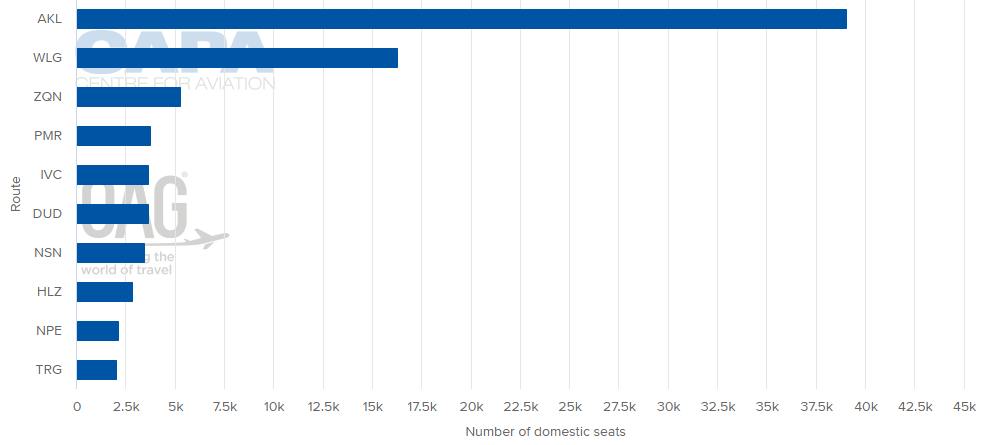
LARGEST INTERNATIONAL DESTINATION MARKETS (w/c 06-Jul-2020)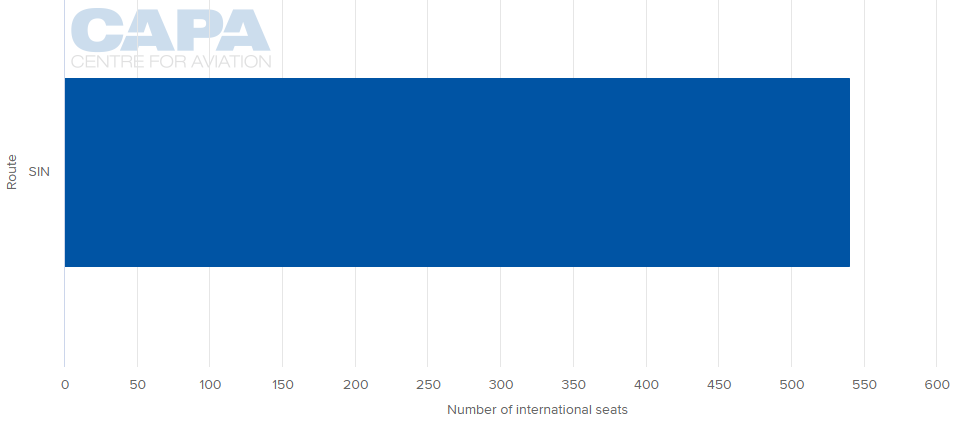
AVERAGE FLIGHT LENGTH (w/c 06-Jul-2020)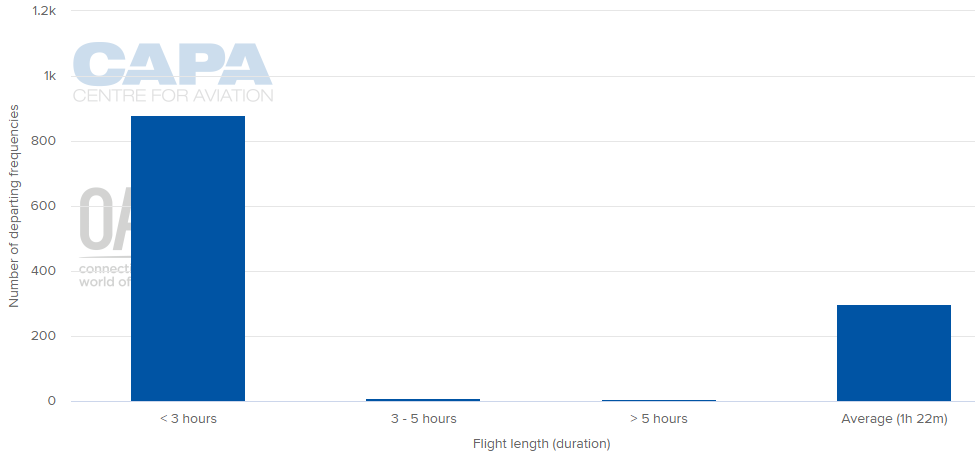
AIRLINE BUSINESS MODEL CAPACITY SPLIT (w/c 06-Jul-2020)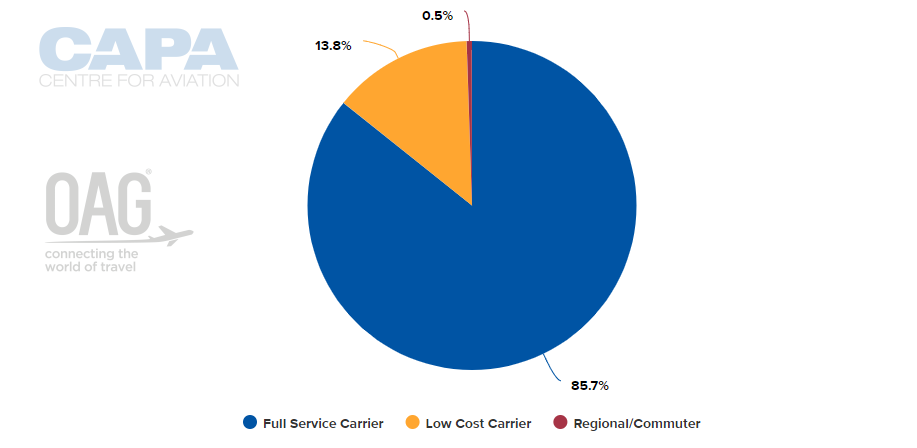
ALLIANCE CAPACITY SPLIT (w/c 06-Jul-2020)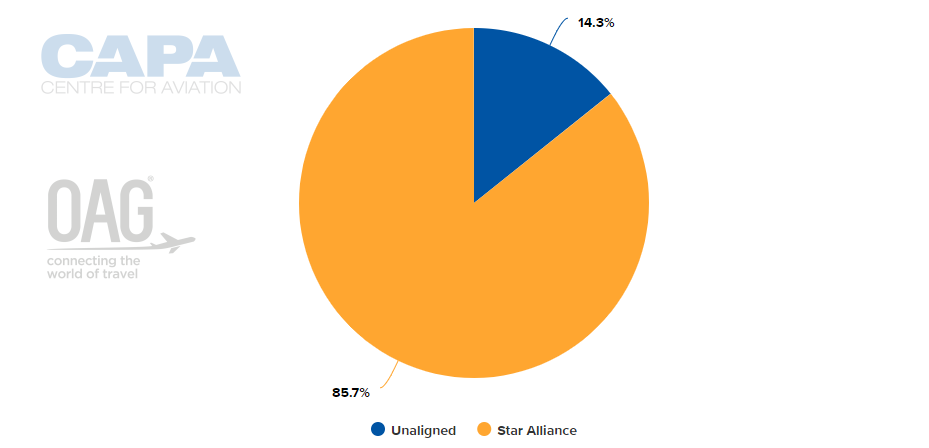
INTERNATIONAL MARKET CAPACITY BREAKDOWN BY REGION (w/c 06-Jul-2020)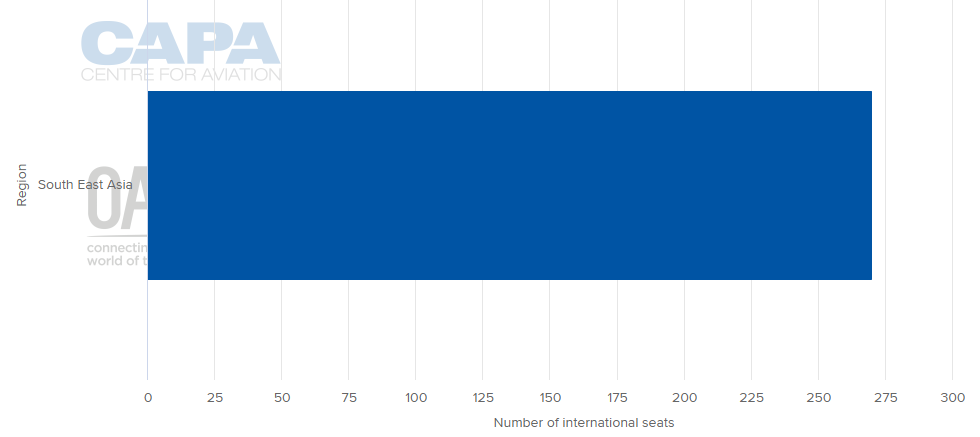
DEPARTING SYSTEM SEATS BY CLASS (w/c 06-Jul-2020)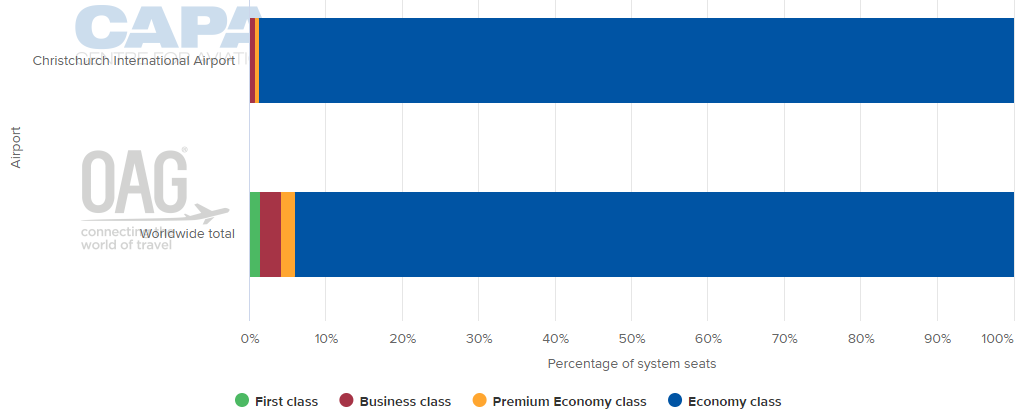
AIRCRAFT OPERATIONS BY MOVEMENTS (w/c 06-Jul-2020)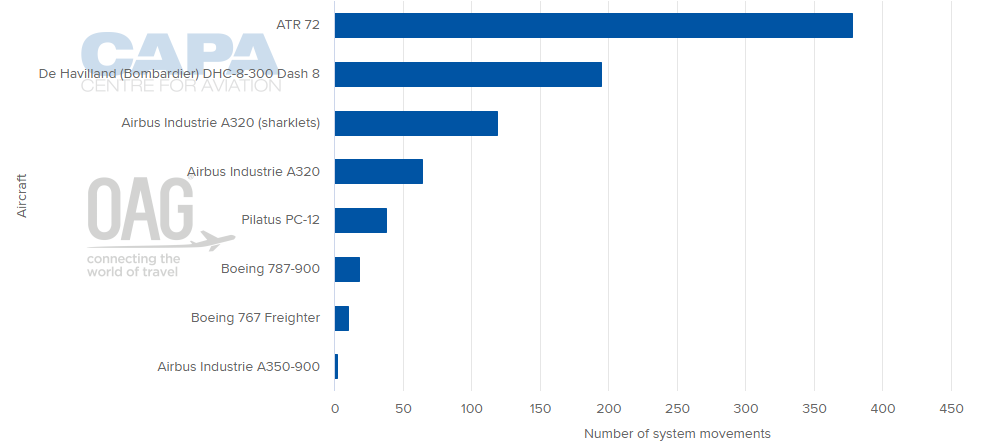
MORE INSIGHTS...
CAPA: 80% recovery in domestic New Zealand airline capacity by end-2020
Airline domestic route rankings highlight Asia-Pacific recovery
Trans-Tasman aviation impacted by Coronavirus COVID-19
New Zealand LCC market: AirAsia pulls out again, leaving only Jetstar