But these are far from normal times and has influenced airport operator Aeris Holdings to rethink its development plans at the air gateway. Its CEO Rafael Mencía has reported the company is working on alternatives to its master plan, which was finalised during Dec-2019.
The airport has already accessed funds set aside for capital development works under the master plan, due to the downturn of traffic and revenue related to the coronavirus pandemic. As a result, the company has put development plans for the airport on hold, including its new four storey terminal building, expanded customs area, relocation of the aviation rescue fire fighting station and installation of an additional baggage carousel.
Juan Santamaría International Airport is expected to see around a 70% year-on-year reduction in demand during 2020 with passenger traffic between Apr-2020 and Aug-2020 just 2% of those levels seen during the same months last year. Since the country's borders reopened at the start of Aug-2020 there has been a shallow rise, but levels still remain down to just over a fifth of last year's performance.
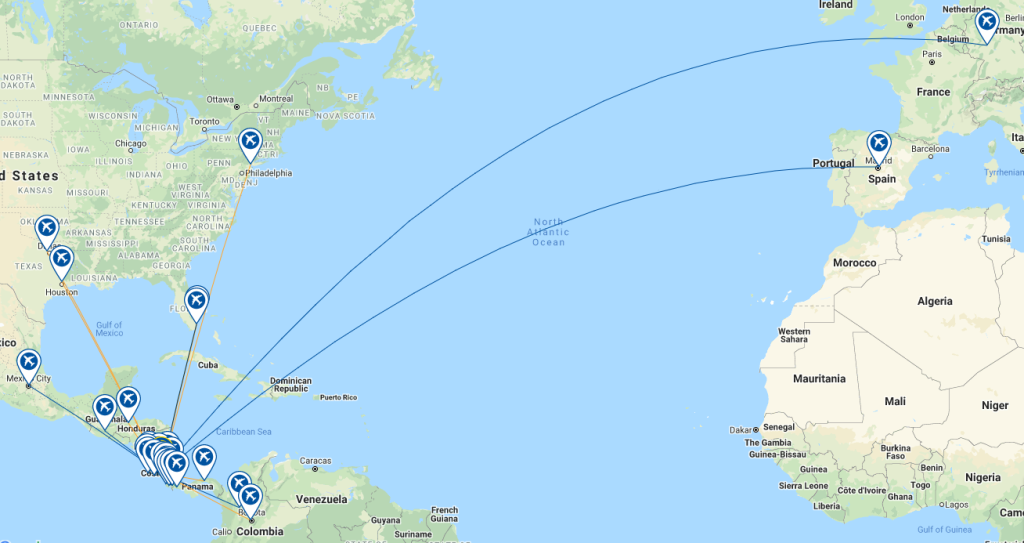
NETWORK MAP (as at 05-Oct-2020)
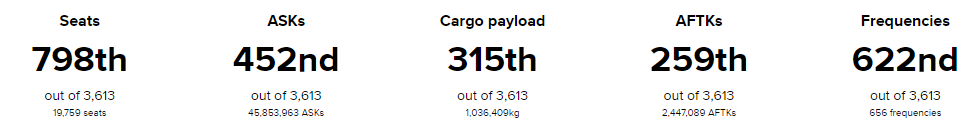
GLOBAL RANKING (as at 05-Oct-2020)
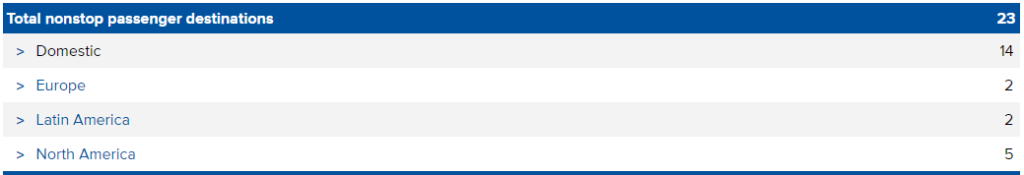
DESTINATIONS (as at 05-Oct-2020)
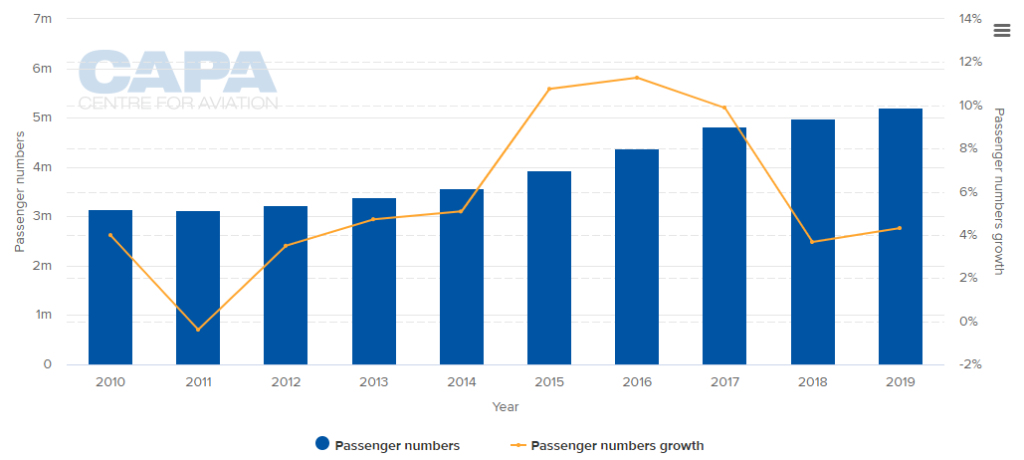
ANNUAL PASSENGER TRAFFIC DEMAND (2010-2019)
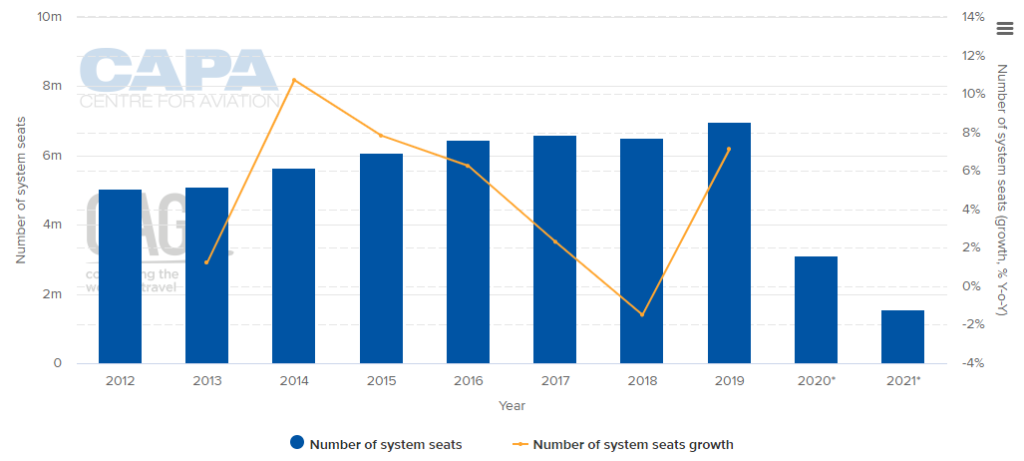
ANNUAL CAPACITY (2012-2020*)NOTE:The values for this year are at least partly predictive up to 6 months and may be subject to change
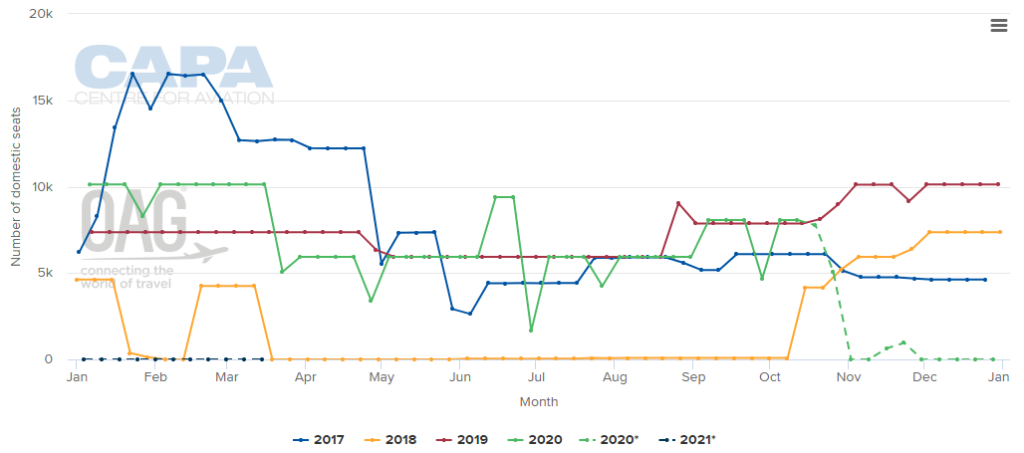
WEEKLY DOMESTIC CAPACITY (2017 - 2020*)NOTE:*the values for this year are at least partly predictive up to six months and may be subject to change.
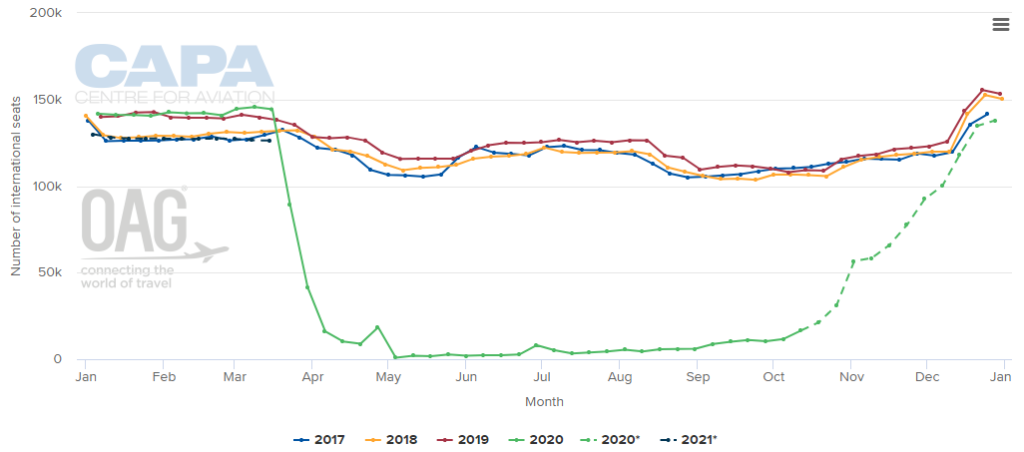
WEEKLY INTERNATIONAL CAPACITY (2017-2020*)NOTE:*the values for this year are at least partly predictive up to six months and may be subject to change.
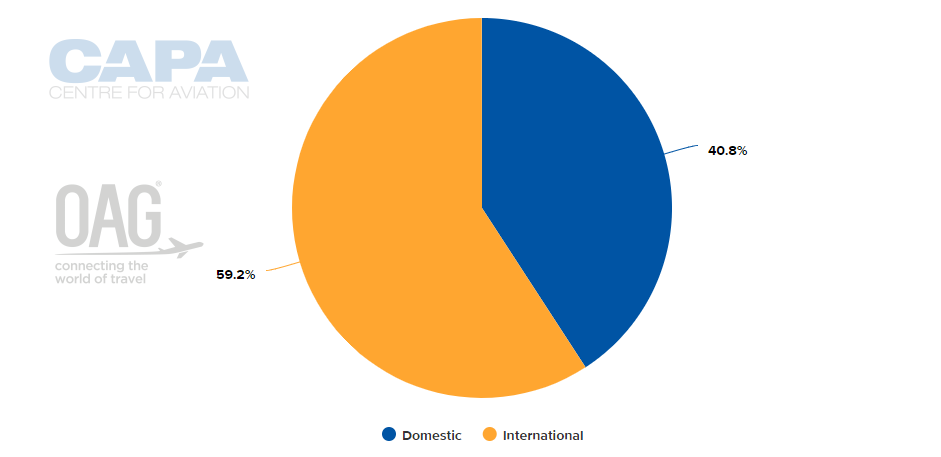
CAPACITY SPLIT BETWEEN DOMESTIC AND INTERNATIONAL OPERATIONS (w/c 05-Oct-2020)
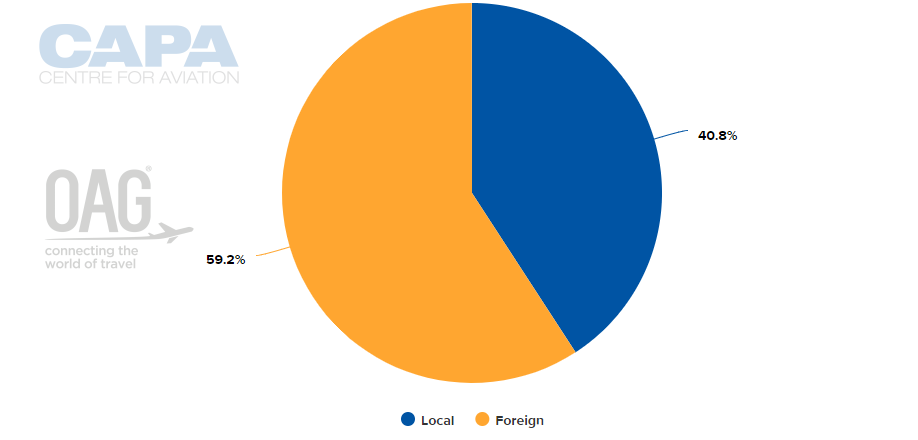
CAPACITY SPLIT BETWEEN LOCAL AND FOREIGN OPERATORS (w/c 05-Oct-2020)
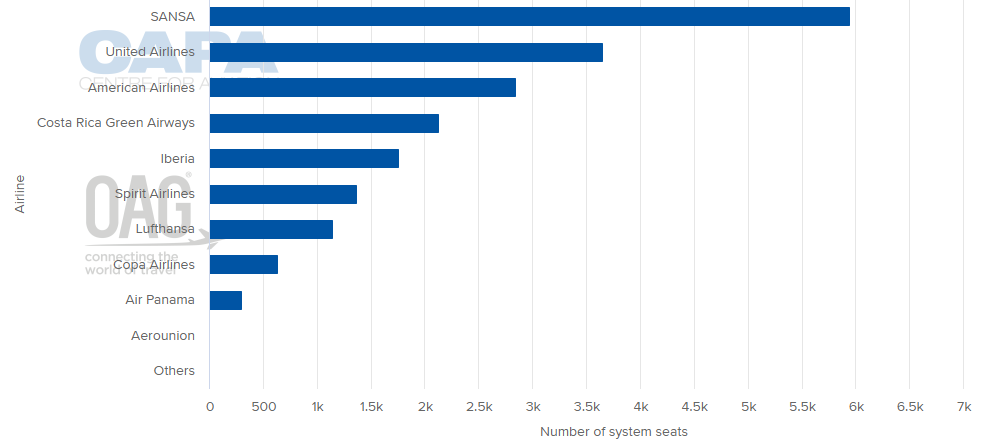
LARGEST AIRLINES BY CAPACITY (w/c 05-Oct-2020)
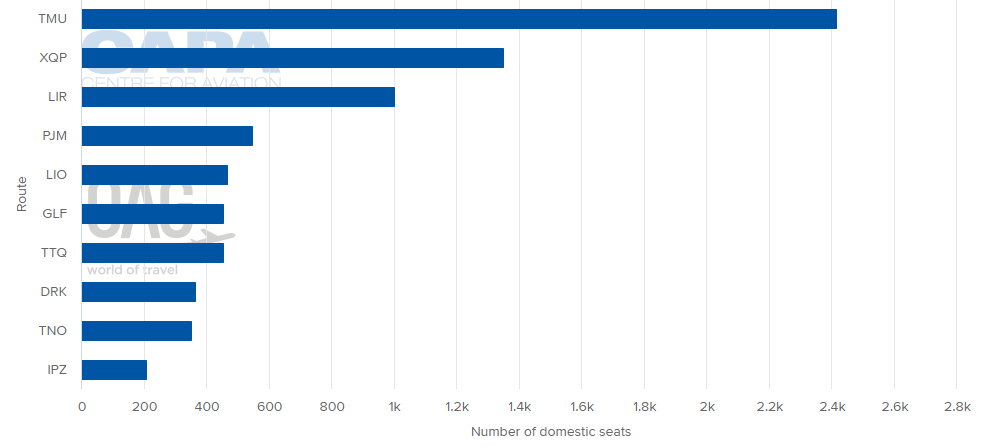
LARGEST DOMESTIC DESTINATION MARKETS (w/c 05-Oct-2020)
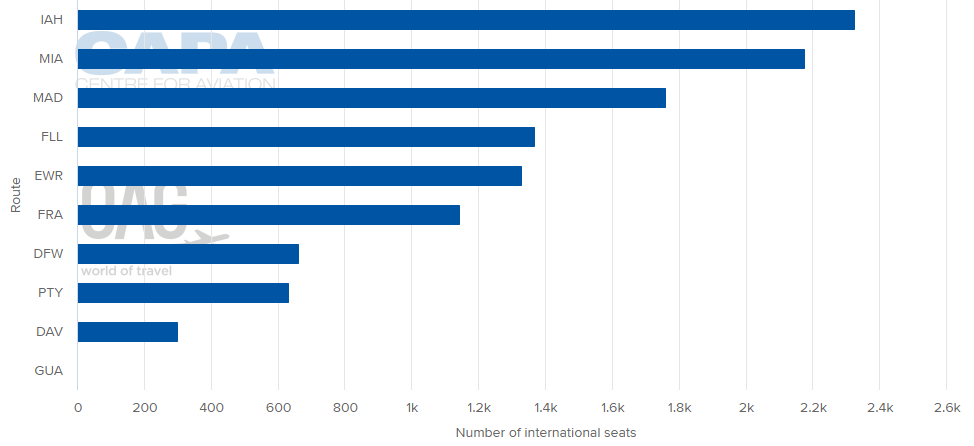
LARGEST INTERNATIONAL DESTINATION MARKETS (w/c 05-Oct-2020)
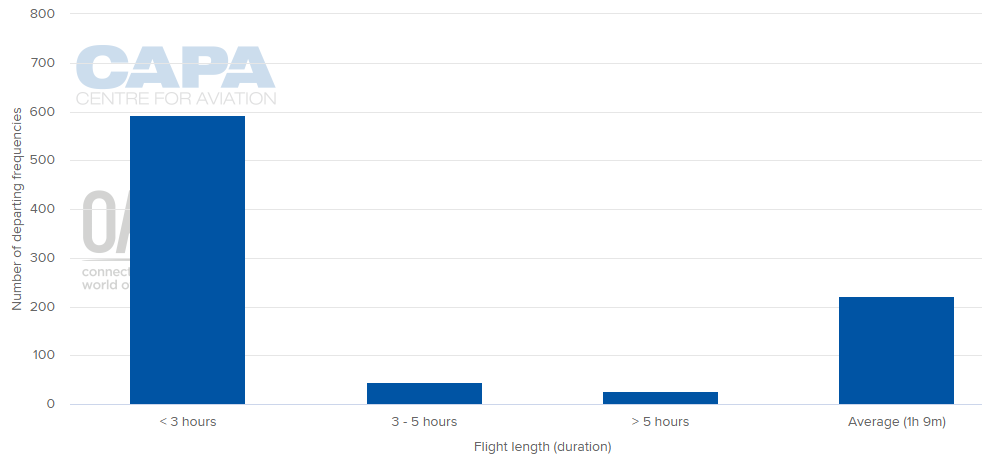
AVERAGE FLIGHT LENGTH (w/c 05-Oct-2020)
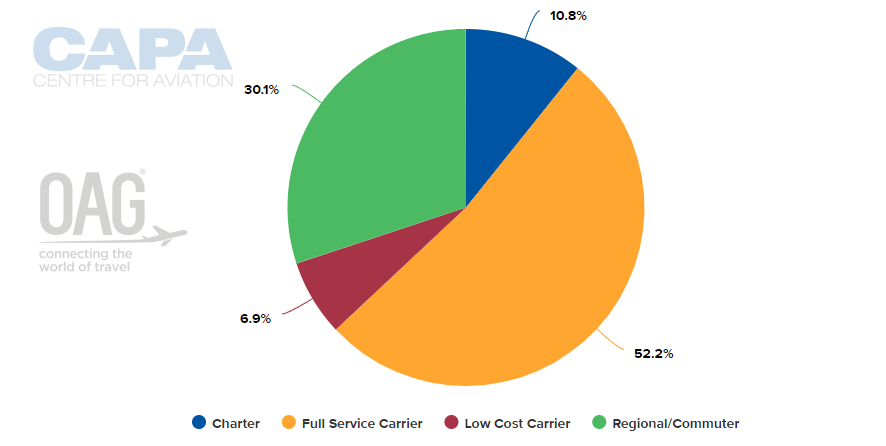
AIRLINE BUSINESS MODEL CAPACITY SPLIT (w/c 05-Oct-2020)
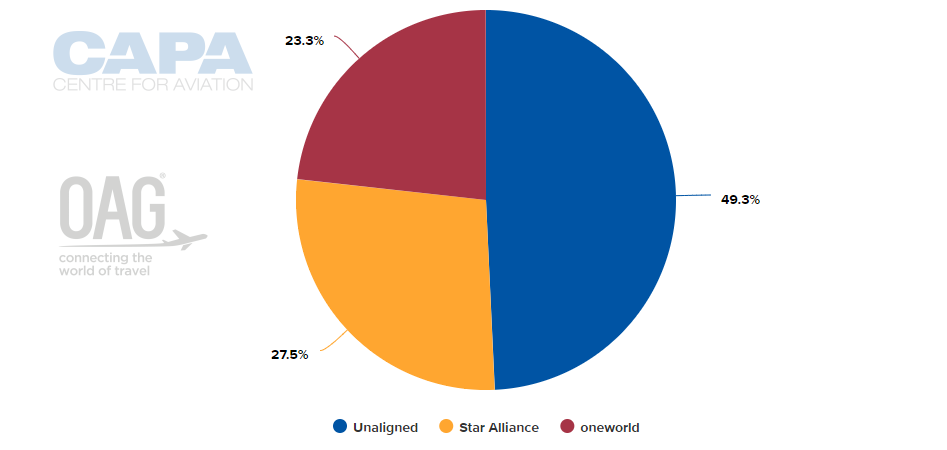
ALLIANCE CAPACITY SPLIT (w/c 05-Oct-2020)
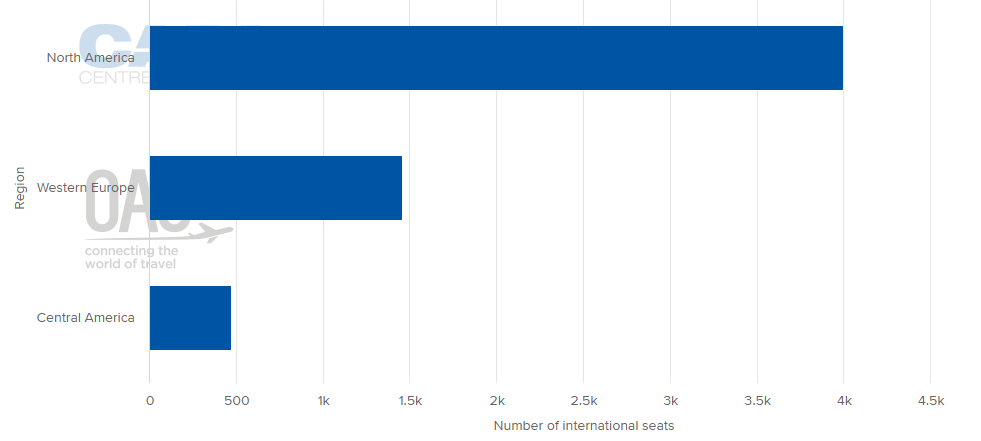
INTERNATIONAL MARKET CAPACITY BREAKDOWN BY REGION (w/c 05-Oct-2020)
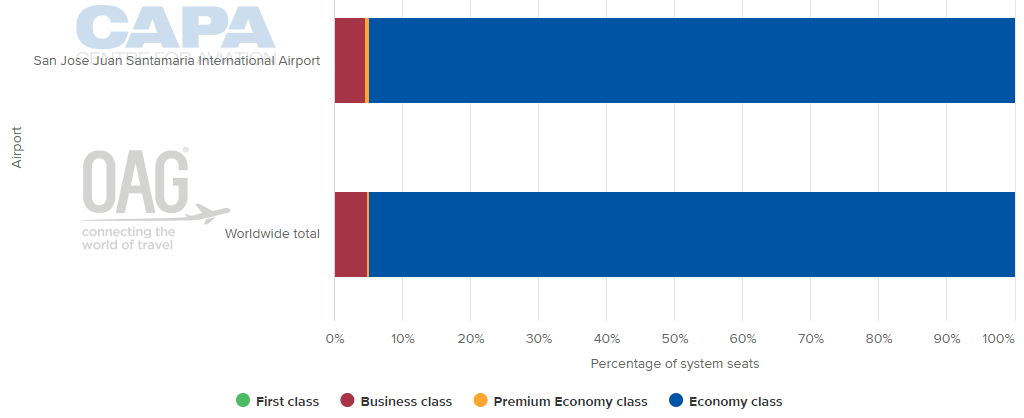
DEPARTING SYSTEM SEATS BY CLASS (w/c 05-Oct-2020)
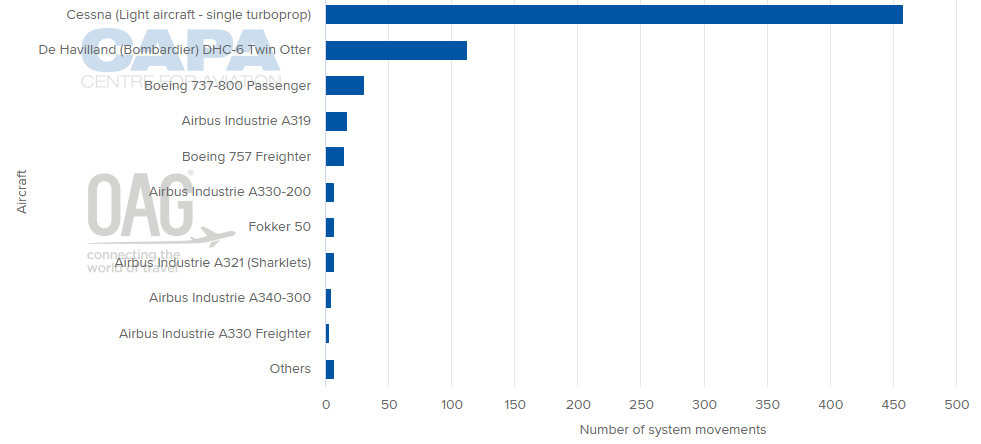
AIRCRAFT OPERATIONS BY MOVEMENTS (w/c 05-Oct-2020)
MORE INSIGHTS...
COVID-19: government aid for Latin airlines still patchy
GOL expects return of business travel in Brazil by end-2020
Europe to Panama aviation: Norwegian mulls new direct UK route